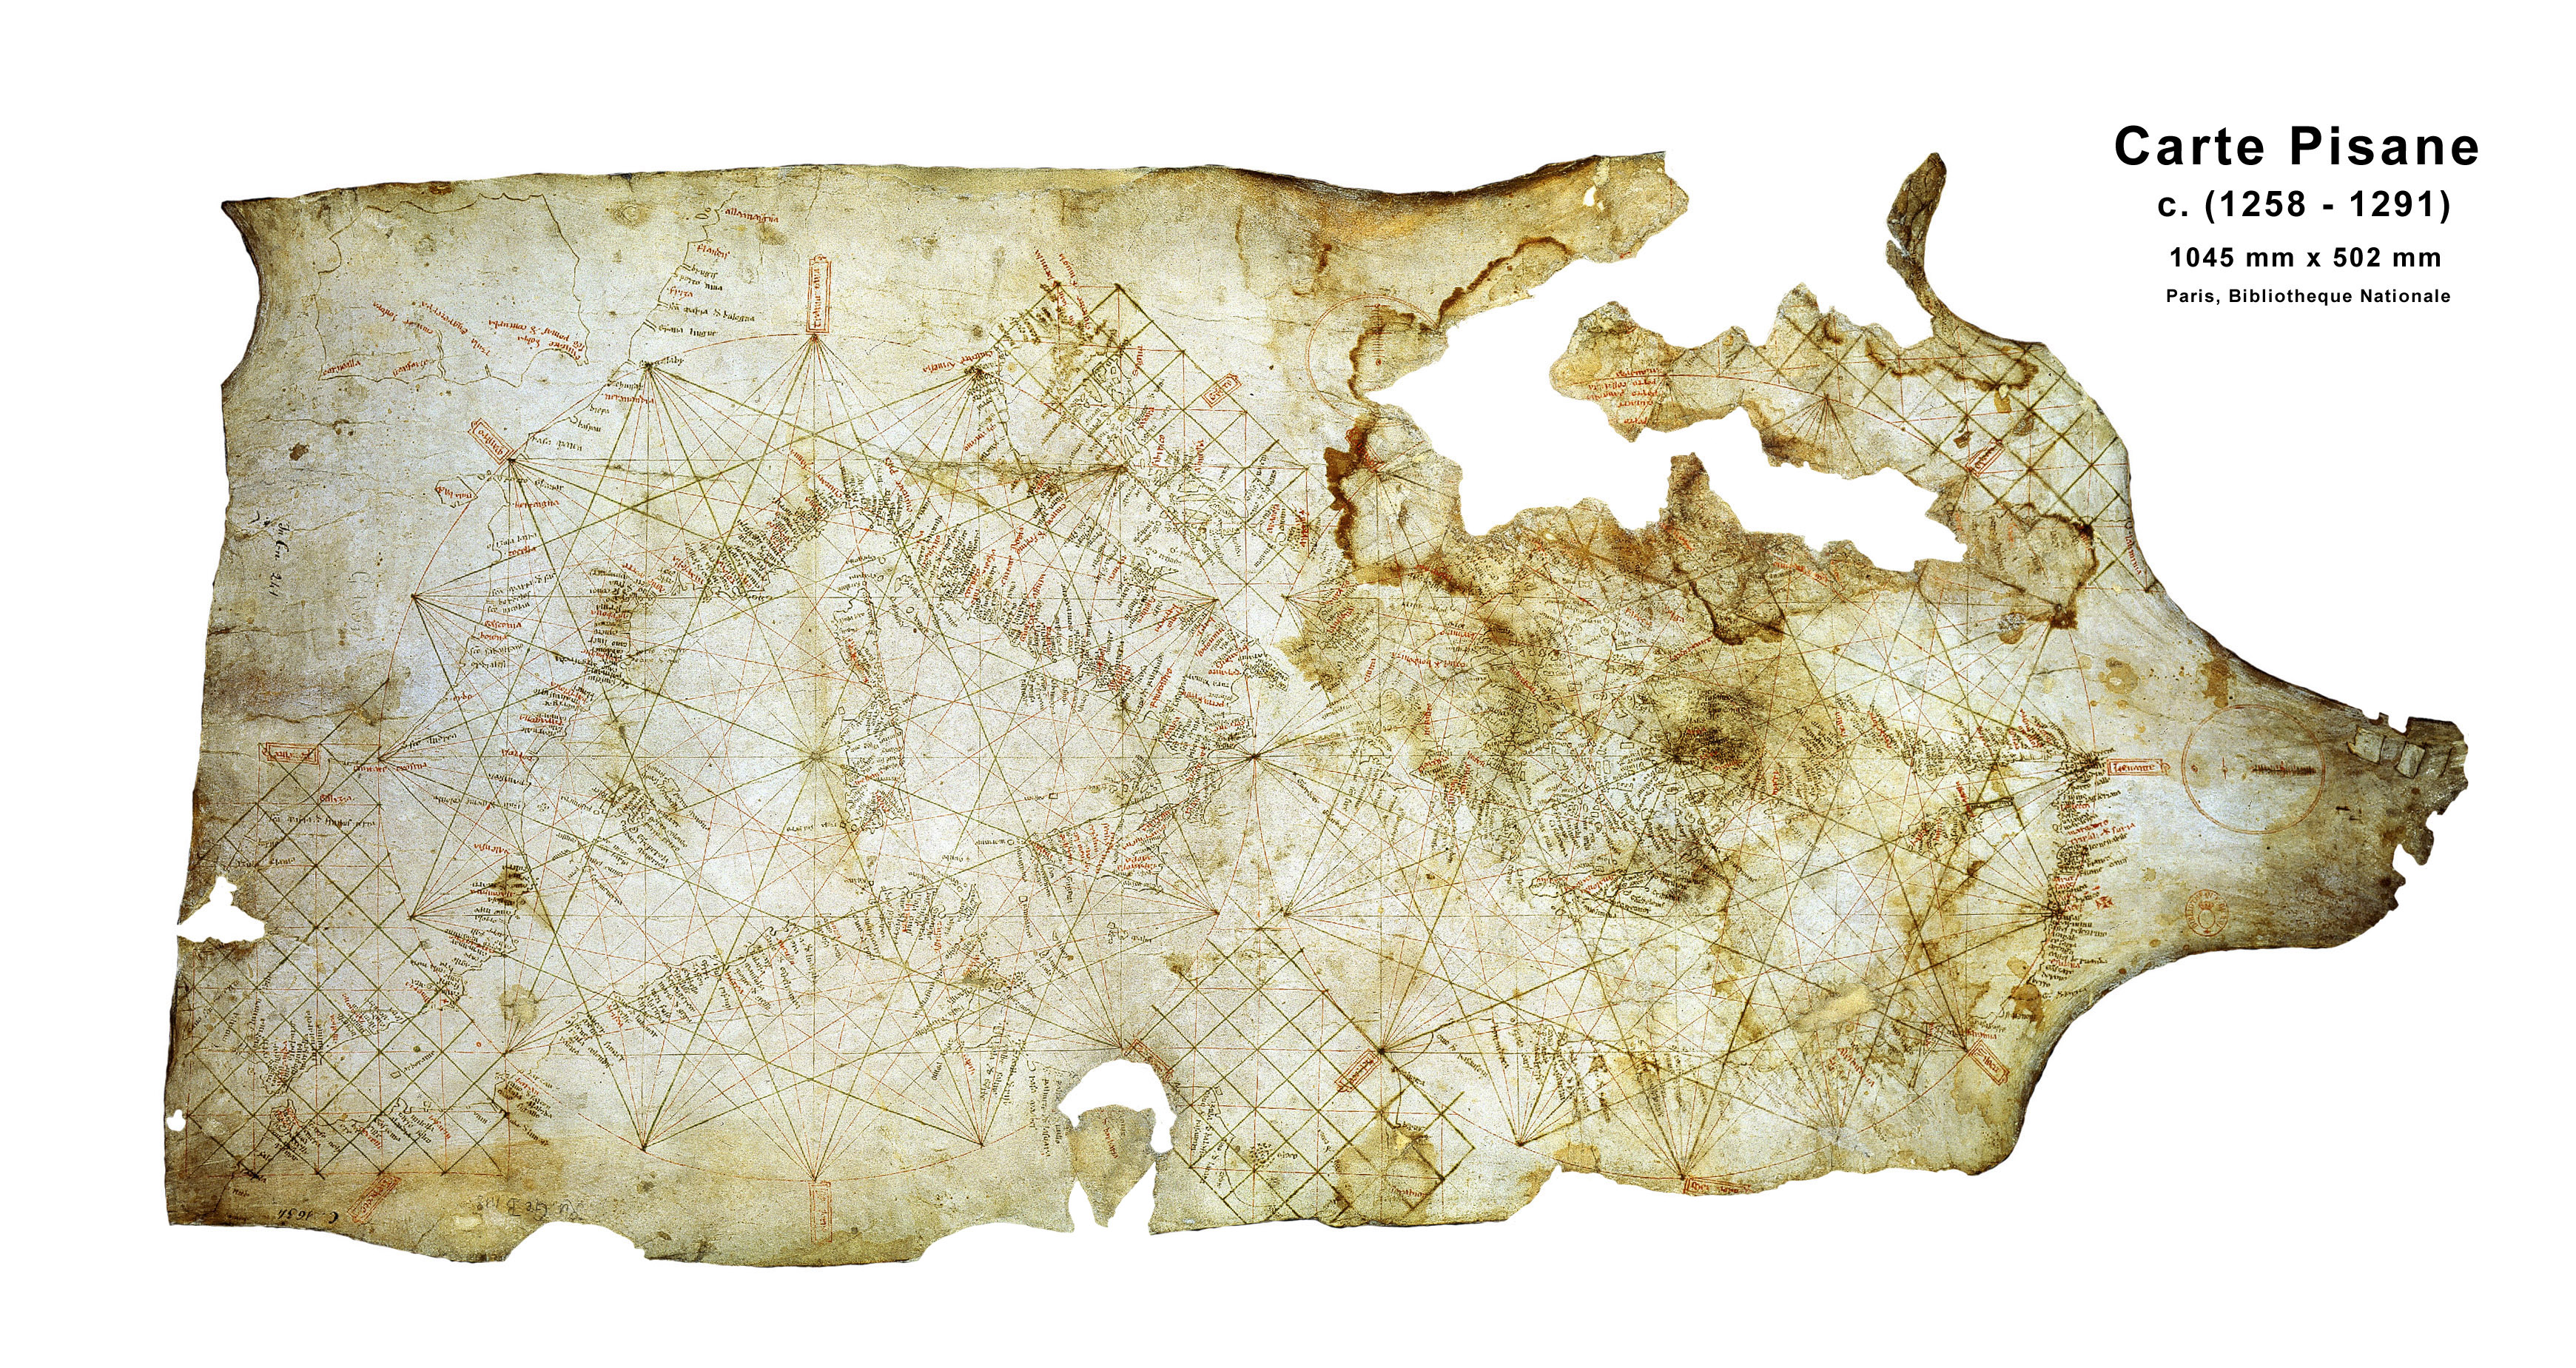
The chart was bought in the 19th century by the BNF from a Pisane family. That is how it got its name. There is nothing known about the time before. According to Pujades, the almost 1000 names at the coastline were "in a linguistic mixture in which Italian dialects clearly predominate".[1]
So it was probably of Italian origin. The only argument in favor of Genoese origin is the fact that the earliest reference to a portolan chart, in 1270, occurred on board a Genoese ship.[2]
From style of handwriting Pujades concluded "We may be sure, therefore, that the individual in question did not belong to the limited circle of scholars who shared the same bookish culture; and he was certainly not a professional clerk."[3]
In the past the Pisane was presented with dates "ca. 1265", "ca. 1275", "ca. 1284", "ca. 1290", "ca. 1300".[4] It is often just called "later 13th century and can be safely attributed to the 1258 - 1291 time frame.
A cross is placed beside Acre. Acre was the last Christian stronghold in the Holy Land and the only reminder of the crusaders' conquest since the beginning of the crusades in the 11th century. The fall of this harbour fortress to the Muslim forces in 1291 was the final end of an era. It was the major historical event in the later 13th century and well noticed in Europe. So it is very likely that the cross was drawn before 1291.
But portolans have a notorius tendency to copy features from older charts in new ones, especially flags or other signs on land. Therefore we have to conclude that 1290 is the youngest date either of the Pisane or a predecessor it may be copied from.
Manfredonia, founded in 1258 is present on the Carte Pisane.[5]
The shape of the vellum is typical for animal skin with the neck near the eastern part of the chart. So it seems he never intended to present the whole Black Sea area. It is one of the largest portolan charts of the Mediterranean. Only four others from the 14th century are of similar size. The reason is that later charts incorporated more of the Atlantic or the east to the Caspian Sea. Larger overall, their size of the Mediterranean is usually smaller.
The scale bar in circles are only known from the Pisane, the Cortona and Vesconte atlas till 1318. All later charts had the scale bars at lines near its borders.
According to Nordenskioeld the chart size is 1.045 x 0.502 meters, according the BNF in 1980 it is 1.050 x 0.500 m. But the outer shape is irregular and no measurement of an inner circle or distance is on the record yet. Thus like for almost all portolan charts a really exact size is not available. But more uncertain is the exact scale of the chart. The center area seems around 1 : 4.15 million.
The size of squares in the grid of the Adriatic, Black Sea and Syrte are not by chance but fit well (Err. < 3 %) to the scale bars. The Atlantic squares are 5 % larger. This was measured at Jomard. It is one of several indications that the chart was compiled by an Atlas with different scales. The chart maker drew a square grid on the atlas with the size of the atlas scale and one on the Pisane with its scale. He then copied by eyesight the coastline from one grid to the other. That way he could adjust the scale without any calculations.
The chart has some holes, especially in the area of the Black Sea. The missing edges are at or close to coastlines. This is not damage caused by animals nor by accidents. Medieval ink was sometimes mixed to be slightly acidic. The effect was only visible after centuries. The ink wandered and destroyed the structure of the vellum. The vellum could lose any strength and whole sections could fall away. In written books even whole letters could fall out.
This effect is supported and accelerated by moisture. Interestingly it is severe only in some parts of the Pisane. This may be an indication that the chart got wet at a time, perhaps by use on a ship. A forensic search after sea salts in this parts is not done yet but may be interesting.
A comparison of photos from the early 1980s and mid 2000s shows only a very small increase in this acid loss. It could be stopped by high dryness but that may damage the vellum too. But anti acid procedures developed in recent times may help or were already applied.
In its present state the chart had undergone a heavy conversational repairs. It now no longer has any holes and looks like new. This is good for its preservation. But it was done in an unusual way by use of very similar looking material. Now even in good photographs it is no longer clearly visible whether some line loss is a repaired hole or a washed away area. The latter is not really lost.
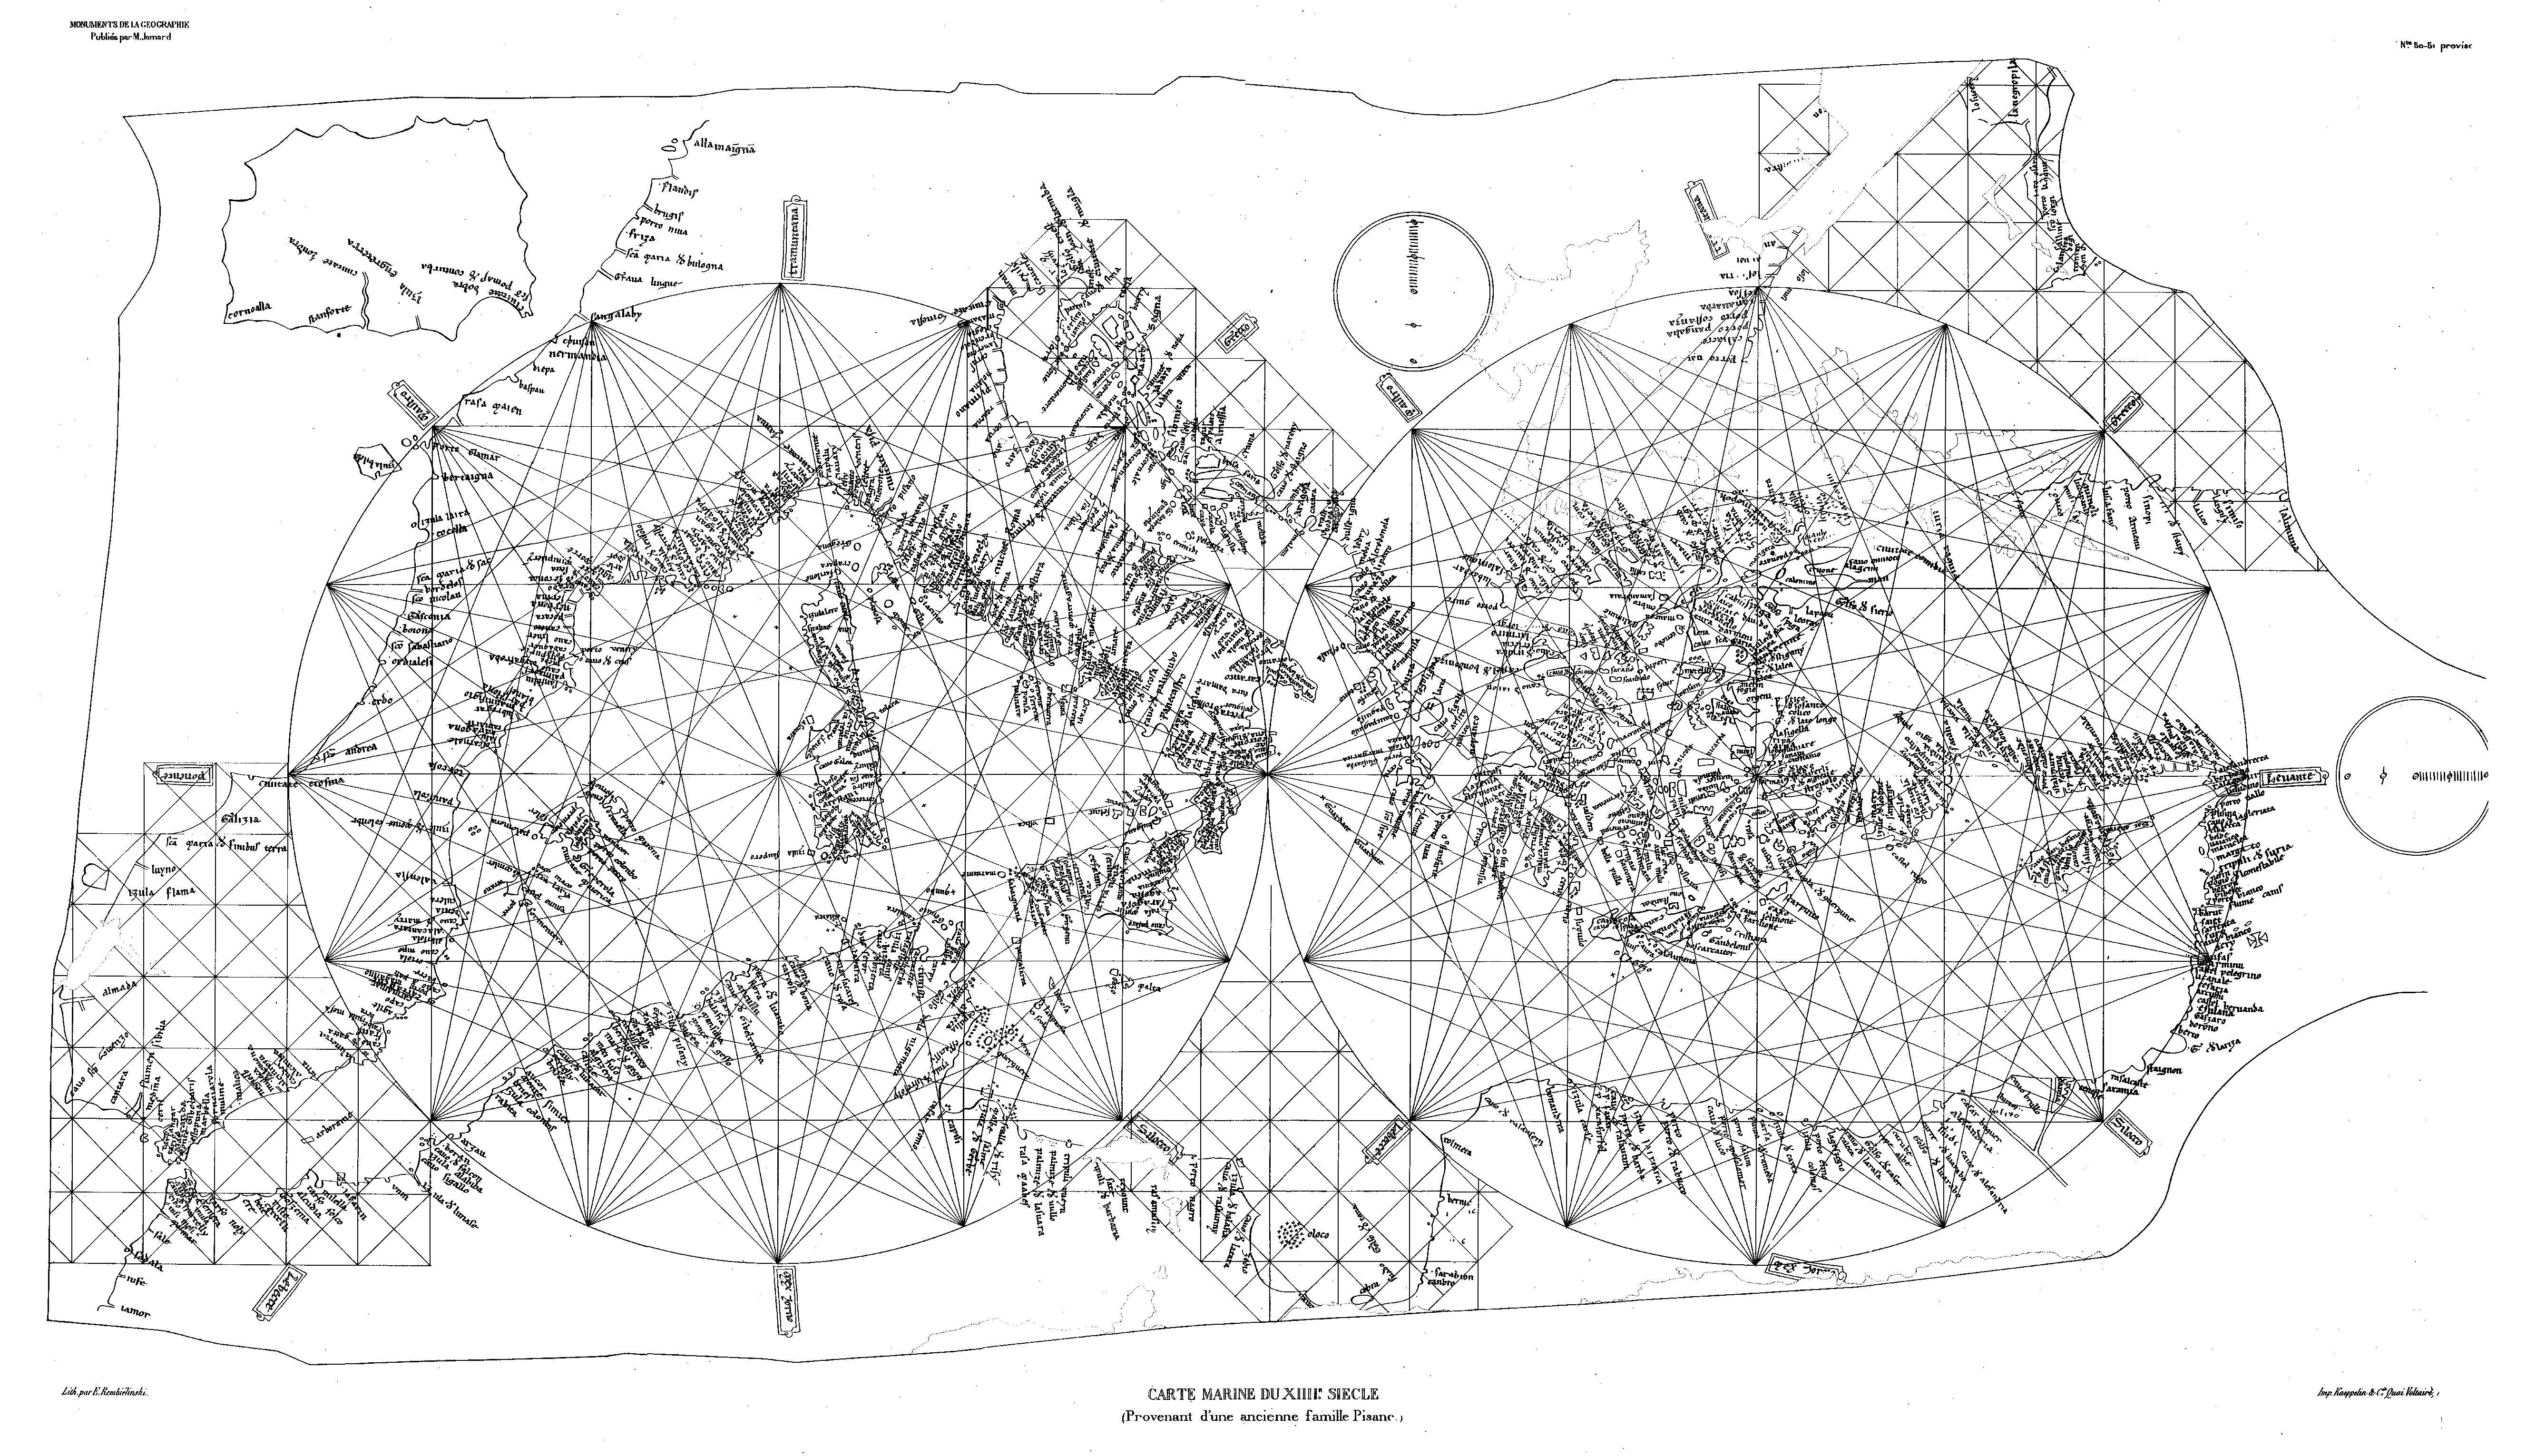
In some of the repaired holes faint lines are visible. This are no parts of the original chart like the "Heliogravure" from the 19th century or Jomard's redrawing indicates. At Jomard's time the chart was in better condition and more was visible. His redrawing is of such high quality that it is the main benchmark of reproduction. The Heliogravure, a later 19th century almost original sized photographic reproduction by the BNF, seems still valuable, too.
A few years ago the question was raised whether the Pisane was in a quality class with other portolans or a predecessor. The shape of Italy was a main point to call later portolans an intense step in evolution.[7] That was questioned by Campbell with the remark that the coastlines are almost the same but the main error affects only the land masses.
Already in 1987, a hundred years after Nordenskioeld, Campbell raised again the question whether the portolan charts may be composed by an atlas and some local distortions may still reveal that process. Could the land distortions in the Pisane be such an indication?
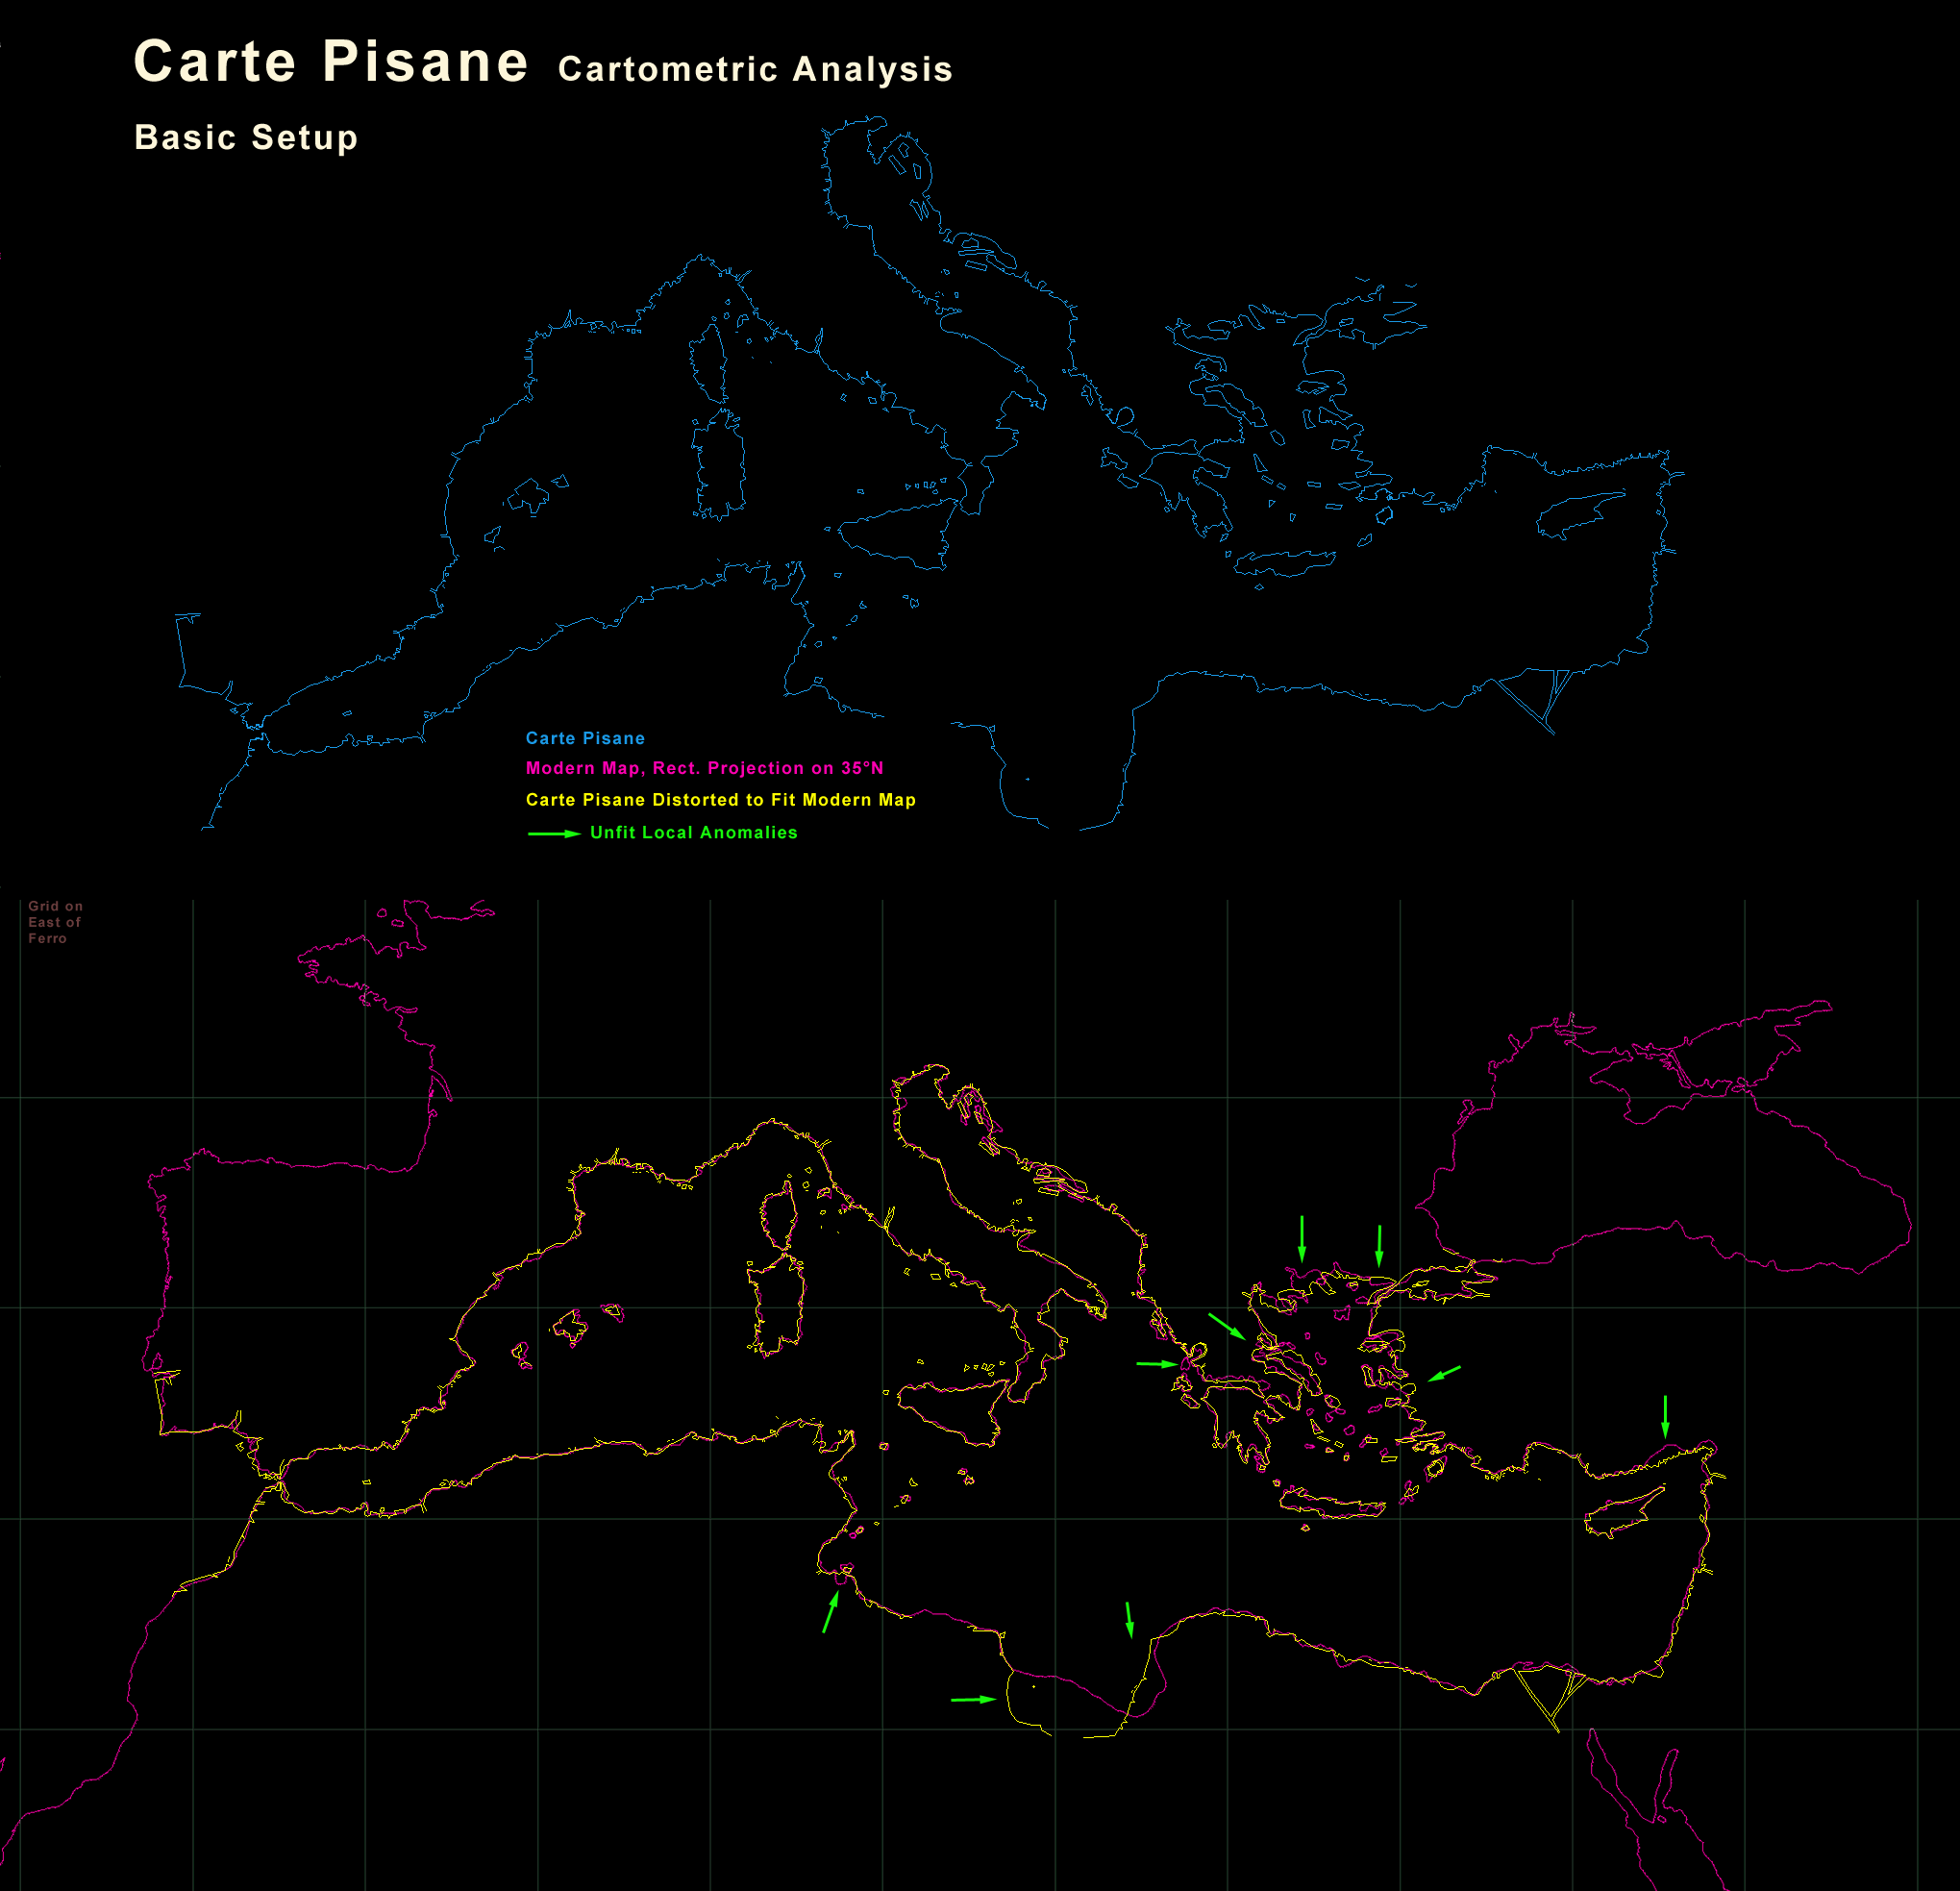
In the following these questions were subject of a cartometric analysis. At first the Pisane was vectorized from the Jomard publication above. These vectors were distorted to fit a modern map. See the Basic Setup graphic. For the modern map an equirectangular projection with an equal latitude of 35° N was chosen just because of simplicity. In an analysis of the 1367 Pizigani chart the noise was to much to decide between Mercator and equirectangular, only the square map was ruled out.The Black Sea of the Pisane was too sketchy for a direct fit and ignored. The Syrte, a poorly known area like on all portolan charts, was not matched for the same reason like some other local anomalies. To enforce a fit would distort the local error statistics. Such obvious anomalies should be subject of historical comparative investigations.
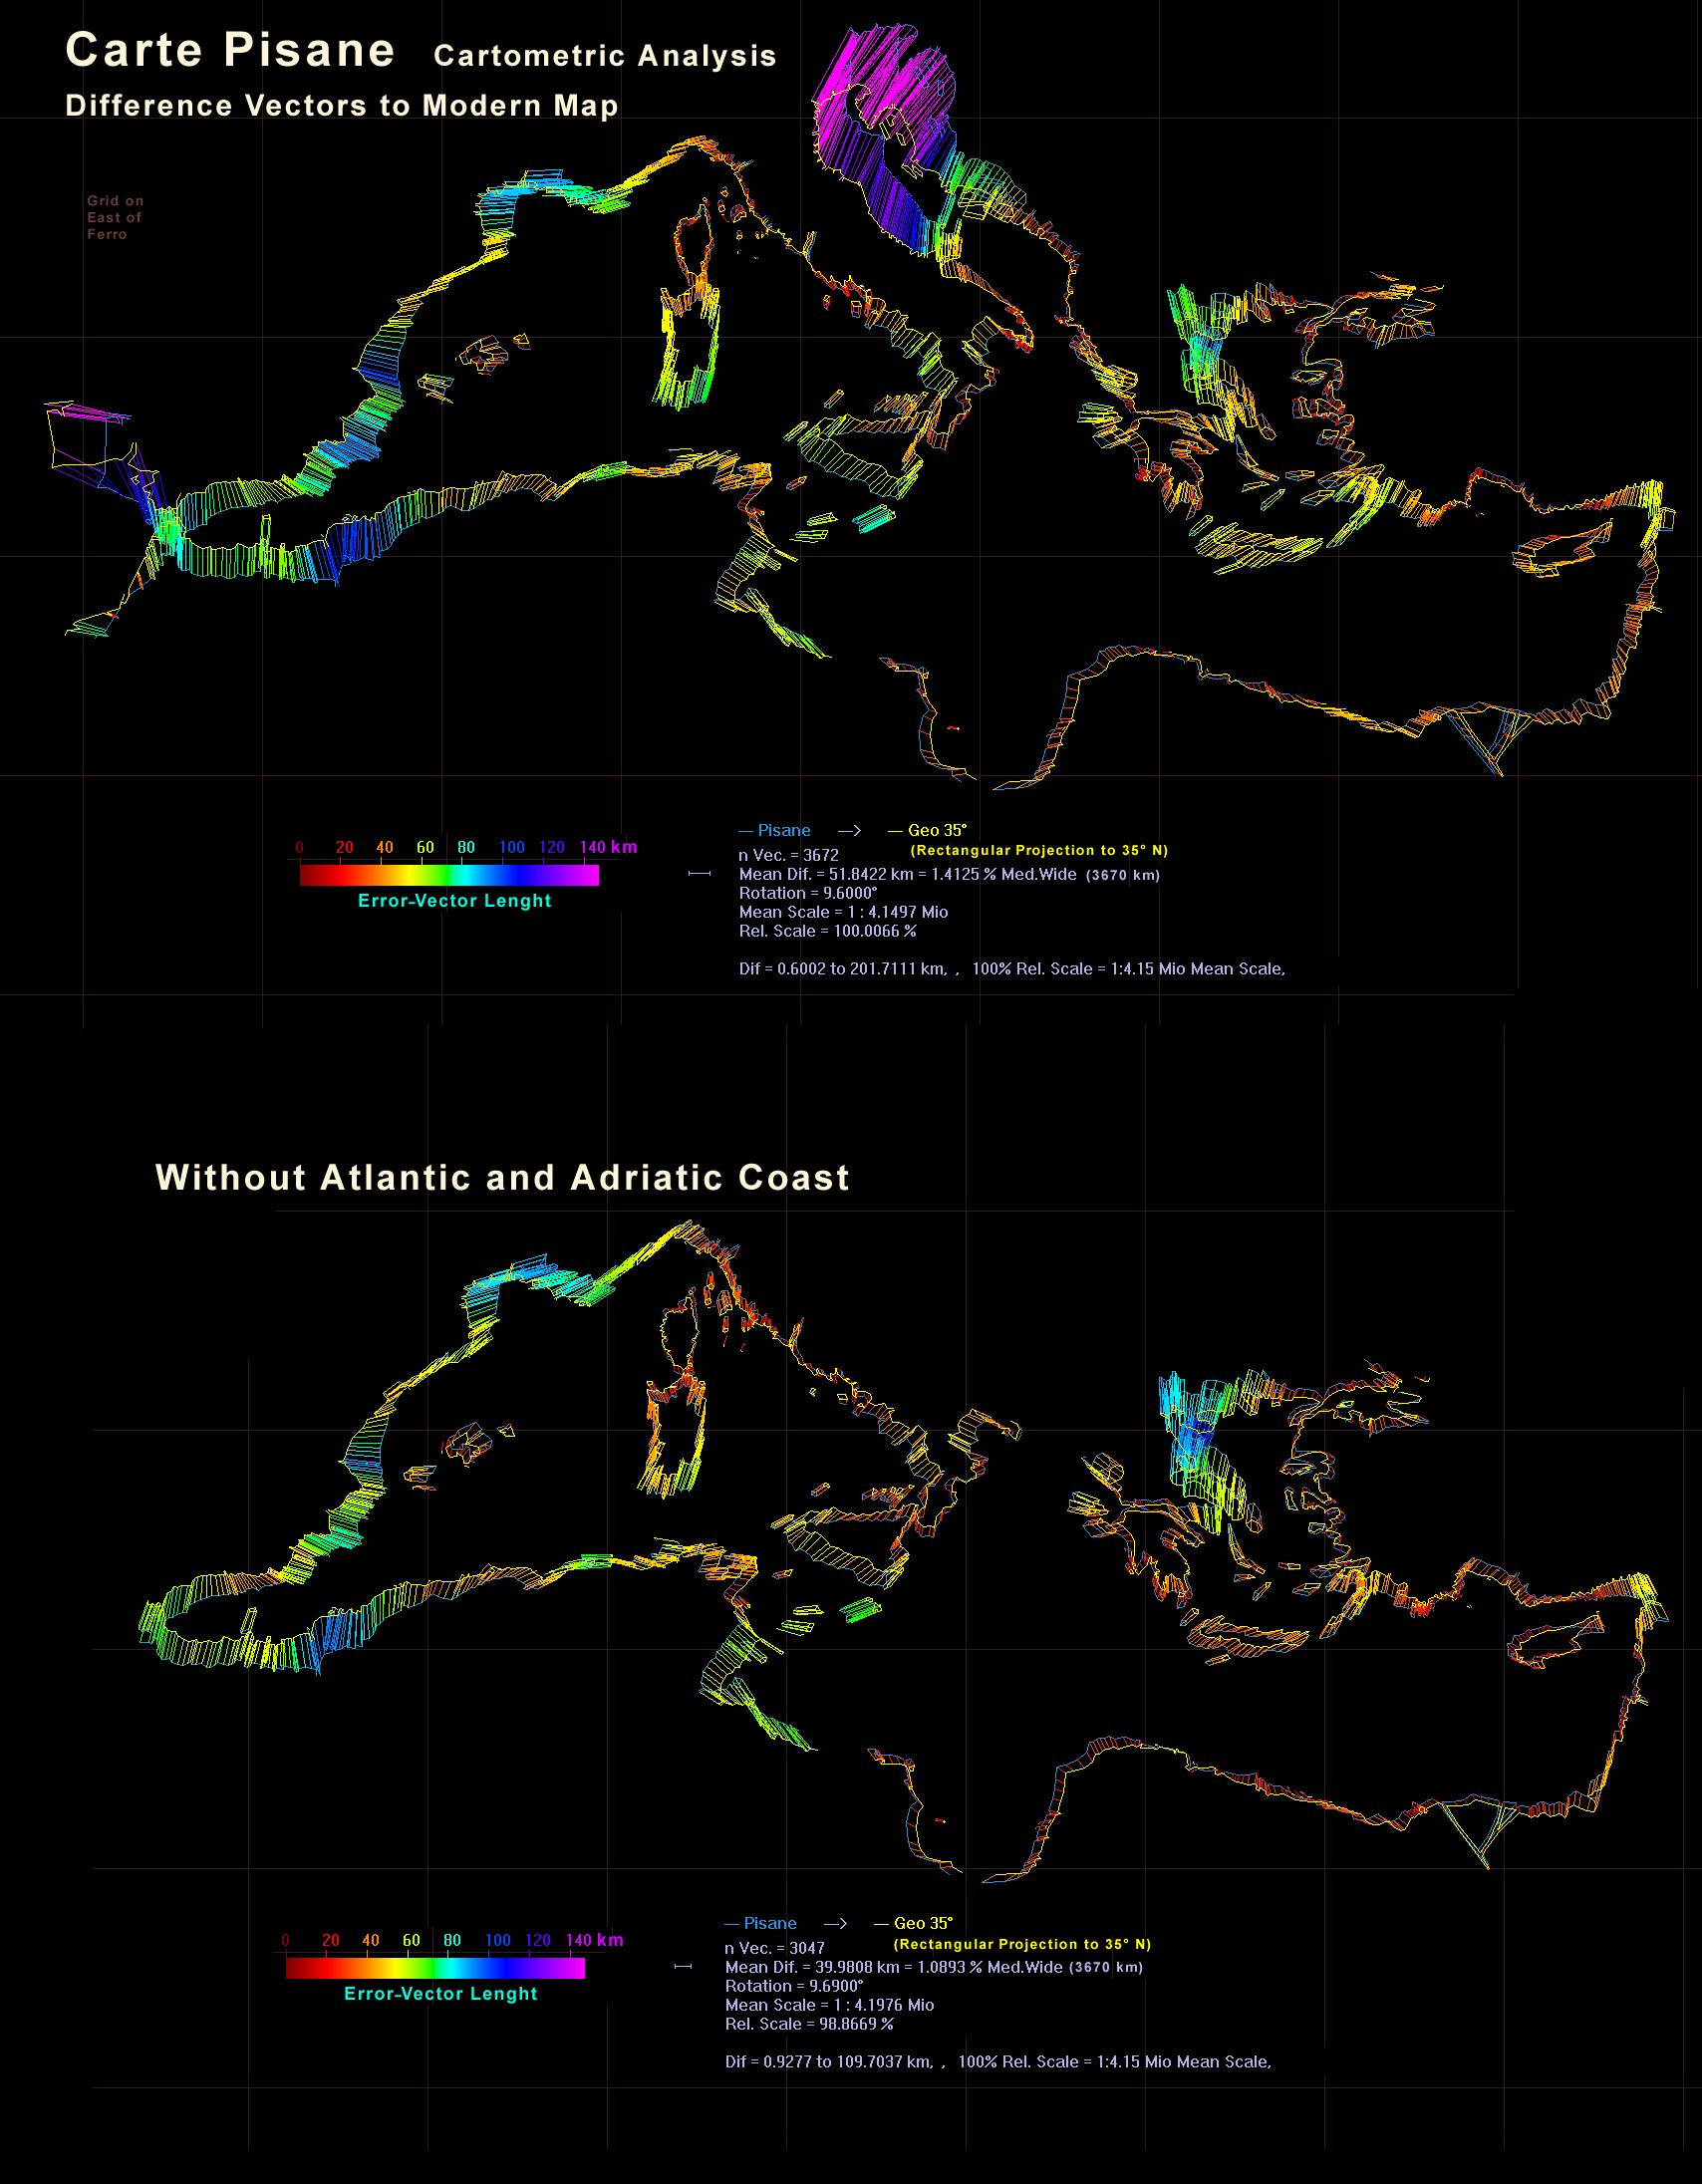
The analysis was between the distorted and the undistorted vector files. A best fit was always created by calculating best scale and rotation. On a first overall calculation (3672 vectors) a mean difference error vector of 51.8 km resulted. Compared to the 3670 km wide of the Mediterranean basin that is only a 1.4 % error. That is in the same class like the 1367 Pizigani chart with an error around 1 %.The Atlantic coast seems shrunken which may reflect the edge of the vellum. Probably the chart maker preferred to shrink it in the east - west direction to get the west coast of the Iberian peninsula to still fit on the vellum. Very interesting was the Adriatic basin. Its entrance had a very low error which linearly increased up to the north to around 200 km always in one direction. That is a clear sign of rotational distortion and makes this area highly suspect of an atlas compilation error.
In a second run without the Adriatic and Atlantic an 40 km (1.1 %) average error resulted by a mean rotation of 9.7° counter clockwise. For rotation, the line of the rhumb circle closest to the north - south direction is the usual reference. The overall Pisane was rotated on average almost the same, 9.6°.
A detail run on the Adriatic alone got an average error of 15.6 km by a rotation of -4.4° and a scale of 107.3 %. That is 4.4° clockwise or a difference of 14° to the average of the whole chart. Further, the Adriatic has a scale of 107.3 % compared to the average overall error. So it was drawn 7.3 % larger.The Pisane was sectioned into 5 parts to see whether an atlas origin was revealed by further substantial reduction in mean error. A mean error of 23 km or 0.63 % was achieved that way. The largest rotation difference is between the Adriatic and the southwest coast section with 17.4° in total. Same to for the largest scale difference with 11 % in total.
The location of the cut points could be questioned. Those chosen here were derived from the error vector field in the overall Pisane. The cut in the east near Cyprus seems beside the Adriatic the most obvious and most unexpected. In some of the sections the local error twice or more gets close to zero or the direction of the error vectors changes. This are potential points of interest for further cuts around it.
But here the analysis reached its limit. Any further cut may certainly reduce the mean error. Once the number of cuts reaches the number of vectors the mean error gets to zero. One needs to have a rationale for further cuts and their positions. The grid net (on Ferro, 18° W) gives no obvious hint.
The intent of this analysis was to identify the atlas parts the Pisane was compiled with. The next step would be an analysis of possible projection types in this parts. Unfortunately only one part, the Adriatic, could clearly be identified. But here, the chartmaker matched the copy grid to the scale bar. That is a very unique feature and it offers proof that he cared for an equal scale for his chart. So any scale differences were already hidden in the atlas drawings he had as source.
The scale difference of the Adriatic versus the southern sections is extraordinary. It is in the 7 to 11 % range, plus about 12 % the equirectangular projection based on 35° N creates. So up to 23 % in total. Neither the Mercator nor any common type of projection can explain this difference.
Most likely the person who copied the atlas from an unknown source did some mistake. It is probable that other parts of the Pisane were affected by the same type of error too. Other charts may be created by the same atlas and contain the same problem.[8] The 1367 Pizigani chart has a Pisane like anomaly in the mid northern Levante too.
Further its Adriatic has a rotation of only 1.5° but the whole Mediterranean basin has 9.8°. And compared to the whole Med its scale is 7 % larger whereas the southwest from Gibraltar to Cape Bon is 4 % smaller. The very same relations like the Pisane had. In the Cortona chart the Adriatic is 6.7 % larger and only 2.1° rotated instead the 8.3° of the whole chart.
It seems the Pisane is only outstanding by its larger rotation error. The sections of this common source atlas had to be identified before any further investigation about possible projections in the portolans.
By correcting rotation and scale of the Adriatic the average error of the Pisane falls below 1 % in a range like most other portolans. This is a very strong indicator that the Pisane was compiled from an atlas. This bold compilation error suggests that the chart maker never before saw a correctly compiled portolan. Although the coastline drawings he had were already in a quality of typical later portolans. This may suggest that the drawings he had were in very low circulation or even kept secret at his time.
It was not possible to identify the cut of the atlas. Probable cut lines like east of Cyprus and in the west at the latitude of Gibraltar were rather unexpected. There is no direct indication for sections on the more obvious geographic basins like suggested by Loomer.
