The History of Portolan Research
← Back to main index
The History of Portolan Research
The history of portolan research can be divided into two different approaches. The mathematical one centered around cartometry was done by cartographers, surveyors, nautical scientists. On the other side, the art and text centered one was done by historians, mostly trained on the Middle Ages and early modern times. The latter dominates English language publications for most of the 20th century until today. The results of cartometry are mostly confined to older German language publications and no longer present in English reviews. The main review was by Tony Campbell in 1987 and is still state of the art in English.[1] Therefore this review is more focused on cartometry.
Joachim Lelewell - the Beginning (1850)
According to Steger (1896), Joachim Lelewell[2] was the first and until Wagner the only one who analyzed modern projections on portolan charts. By drawing meridians and parallels in portolans he found curved parallels, but with a different radius from chart to chart and even within the same chart. He concluded that probably data from dead reckoning navigation was used and the errors on the data created different charts. He thought the chart maker did not care for a projection but wanted a best fit for his conflicting data points.
Lelewell (1850) Cartometry
Steger found that Lelewel operated with much too small maps, ranging in scale from 1 : 25 - 40 million. That is about 10 to 20 % the original chart size. By that scale it was also impossible to decide whether some other type of grid may fit. Even Lelewel in one case used an equirectangular grid and excused it with reference to the small scale.
Besides the technical limits of his analysis, Lelewel presented the later vocal theoretical arguments for dead reckoning based projections. By keeping accurate direction measurements and ignoring the distance error, one gets a projection with straight parallels like Mercator. But if one keeps accurate distance measurements and ignores direction errors a tendency to a projection with curved parallels will result. How the errors of dead reckoning compare with the accuracy of the portolans was not investigated. It never ever was in publications of the 19th or 20th century.
Peschel and D'Avezac
Peschel and D'Avezac suggested an equirectangular projection as a most likely result based on dead reckoning data. The idea is that a compromise of the conflicting direction and distance data would unintentionally result in something like this projection. Peschel suggested that the magnetic declination was the origin of the common ca. 9° chart tilt and expect the magnetic variation to be present too. All of these were theoretical suggestions without any basis in measurements.[3]
Breusing and Fiorini
In 1869 Arthur Breusing, chief of Bremen's school of nautical science, protested against Peschel and D'Avezac.[4] He saw Mercator projection as the only possibility. By keeping a loxodromic magnetic course the medieval ships relied on direction data. This data was collected and created the portolan charts - by neglecting the conflicting distance data. That way the portolans were "loxodromic" maps in Mercator projection without any knowledge or need for mathematical projections.
Like Steger (1895) noted, this is under the unmentioned assumption that a medieval ship could even keep a loxodromic course. Further, Breusing only suggested a Mercator projection, he never gave evidence that the portolans would fit it. Nevertheless he was considered such an authority and used such explicit wording that he created the general opinion on the matter until 1895.
The Italian mathematician Matteo Fiorini received less publicity.[5] Inspired by the circular rhumb net at the center of most portolans, he thought this would reflect an azimuthal projection.
Hermann Wagner
Hermann Wagner was a leading German geographer of the 19th century. In 1918 he mentioned his publications from the 1890s on portolans and said his results were still generally agreed on or at least not disproved.[6] Actually for the whole 20th century they were never disputed but simply ignored. At least for the English speaking world this could be the result of a 1948 article by Heinrich Winter.[7]
Winter, a historian focused on art and with no link to cartometry, did his best to promote his own opinion on portolans as the one of Hermann Wagner too. Wagner's results were not even mentioned and any frank reader got the very wrong conclusion that Wagner was close to the opinion that portolans originate by medieval compass based dead reckoning navigation. There is strong evidence that Winter deliberately deceived the reader.[8]
Wagner's most extensive article on the subject is a transcript of a lecture he held at the the German geographical council in 1895.[9]
Almost the same content but shorter was a lecture he gave on the Sixth International Geographical Congress in London on 2 August 1895. It was published the next year.[10]
The following is a summary of both papers combined. Focused on the German paper I added parts of the English paper for reference. After more than 100 years this is the first true summary of Wagner's research in English.
Dead Reckoning was a Speculation
In the German paper he begins the topic with the reminder that the portolans were considered a scientific mystery ("wissenschaftliches Rätsel"), until Breusing in 1881 spread his opinion that the portolans were created by compass based dead reckoning navigation in the 13th century.[11]
Wagner said he himself supported that view until he did a deeper study. Now he states that he will demolish the "building of speculations" of Breusing.[12]
Portolans and Development after 1300
In the English paper he further put the theory of Breusing in the context of later charts. A "transition from the loxodromic map of the middle ages to the plane charts of the sixteenth and seventeenth centuries involves a real retrogression in the development" which he considers "by no means probable".[13]
In German he focused on the developmental history of nautical charts. He said it took from its invention over 250 years until the Mercator projection was in general use. For accurate size of the Atlantic coast almost 400 years were necessary. By such conservatism it is "a priori" unbelievable that the portolans were created in the 13th century alone.[14]
Portolan Cartometry
This extreme conservatism in nautical science is reflected by the portolans too. In a detailed cartometric analysis he found several errors that were kept in the portolans for centuries. The south coast of Sardinia is too close to Africa. The west and east coast of Greece are shifted like in some Ptolemy maps. The scale of the Mediterranean is 1/5 to 1/6 smaller than the Atlantic. Here he concluded that maps of different scale were compounded to a single image.[15]
Therefore he recommended an independent analysis of each Mediterranean basin. He did that and found no curved meridians or parallels there. That rules out a common azimuthal projection like Fiorini suggested.[16]
His measurements found no systematic change in latitude size like necessary by Breusings theory. Therefore, Wagner writes: "the hypothesis of loxodromic charts of the Middle Ages cannot be maintained."[17]
Wagner Cartometric (1895)
Wagner did measurements on the mile scale of the portolans and found the Atlantic close to the classical Roman mile. But the Mediterranean mile was considerable smaller. In some books and charts of the 18th century he found mention of a special "Italian-Greek" or "Greek" mile of in the Mediterranean of ca. 1250 meter (4100 feet). So he assumed the Mediterranean basin may be based on a map from classical Greek times.[18]
He noted that in the Carte Pisane the Adriatic basin is one nautical point (11.25°) more inclined to the North. A geographic grid over the Pisane shows a correct orientation of the Adriatic but a tilt of all other parts. From that he concluded that good maps of the Adriatic existed before introduction of the compass and on later maps the rotation of the Adriatic like the rest was done under influence of the compass.[19] He sees the transition from one basin to another as the main problem of the chart maker in the late 13th century.
He assumed western declination in the 12th to 14th century. But if the compass played a crucial role like some assumed, then the portolans were prepared in an earlier time when eastern declination was present again. He sees the compass only as a secondary issue. It may have helped the Italians in compiling ancient maps of the basins to a single chart.[20]
Regarding nautical latitude measurements he brought examples how inaccurate it was even around 1500. So the portolan Atlantic could not be done by the Portuguese.[21]
He saw evidence that the majority of the chart makers were not aware of the most obvious errors. For example Giraldi (1426), Beccario (1436) and the Mappemundi of Luzern corrected the scale of the Atlantic by dilatation to a similar scale like in the Mediterranean. But this corrections went not in general acceptance. Neither did anyone ever scale corrections for the Black Sea.[22]
In another example he mentioned how poor the German sailing books used in the beginning related German to Italian miles. He concluded that the measurements of the medievals were too uncertain to note the difference of the Atlantic / Mediterranean scale in daily use. The worse inaccuracies in charts of the North Sea and Baltic until the 17th century he considers a good examples for the general development of charts. The portolans have to be seen in this context.
Compilation from Maps of Classical times
Near the end he focused on the similar error around Greece in portolans and Ptolemy.[23]
In the German paper he considered this as proof that the medieval Italians were in the possession of transmitted classical maps.[24]
In both papers his conclusion is focused on portolan chart accuracy versus the real navigation accuracy. The 300 years it took to remove the scale error between Atlantic and Mediterranean shows the (poor) accuracy of early modern navigation. The 13th century could not be any better and therefore it is a mistake by historians to place the portolan origin there.[25]
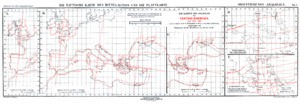
Not every reader may have realized that Wagner in both papers gave values to the accuracy of portolans. During the London lecture he presented a chart with "hundreds of courses...obtained from six different sources" that is not known in reproduction anywhere. With this courses he estimated the "miglio" of the portolans to 3800 - 4200 feet in the Mediterranean. That is 4000 feet +- 5 %. But the miglio of the Atlantic he found close to a Roman mile of 4850 feet.[26]
That 4850 feet Atlantic mile is 21 % larger than the Mediterranean one and well outside his 5 % error range there. This is one of his lines of proof that the Italians could not be the originators of the portolans, but just the compilers like he asserted.
Wagner's last known remarks on portolans are in his book on geography of 1920.[27] Here he assumed the charts to be compiled from smaller maps without projection. But there is silence on the numbers and size of those maps. He seems not aware of the error accumulation problem of this assumption - like Grosjean presented 59 years later.
Ernst Steger
In his two own publications Wagner was limited in word space. The doctoral dissertation of his "pupil" Steger was not.[28] It was done in 1895, too, and the measurements Wagner mentioned were probably done by Steger. Here further results unmentioned by Wagner will be presented.
Link to Portolan Books
Steger compared the distances he measured from portolan charts with those mentioned in portolan books.[29] He found the distances in the portolan books match those on the charts well within the errors of the charts. Steger tried to create a chart from the book but failed. The books simply had not enough data.[30] He concluded that the books and charts were from a common source. Most interesting he found some of the same distance errors measured in the charts literally in the books.[31] That seems a strong indication that the portolan books were derived from something like a portolan chart. It is hard to imagine a common source that is not a chart.
Scale Fluctuations
By determining the scale of the portolan mile he found values from 1 to 2 km in different parts of the Mediterranean similar in charts and books.[32]
The scale error between charts was according the values he presented typical around 3 to 4%. But in one example in one atlas it was up to 17% from one map to another. Probably an error in "scale bar" size. He noted that such big errors were unusual even between charts.[33]
Steger Cartometric (1896)
The major errors he found between the Mediterranean basins. Inside the basins the scale was mostly stable. Two sub-basins (Gulf of Valencia, Sardina - Sicily) were smaller drawn than the main basin. He considers such an anomaly, in all portolans, typical evidence for a compilation from different map sets. The portolans were compiled from smaller maps he concludes.[34]
Further these systematic basin related errors rule out any compilation by dead reckoning navigation.[35]
He found in the Giraldi atlas of 1426 the scale of the Mediterranean (cut in 3 maps) varied from 1 : 6.6 million to 1 : 9 million depending on the basins:[36]
- Iberian basin (0-5° W): 6.935 - 6.937 million
- West basin (0-11° E): 7.13 - 7.53
- Thyrennian sea (10-14° E): 7.3 - 7.5
- Between West/East basin (11-14° E): 8.5 - 9.0
- Ionionan Sea (13-22° E): 7.0 - 8.0
- East basin (27 - 36° E): 6.6 - 7.25
Projections and Magnetic Declination
Then he investigated the different projections previously suggested for portolans. Much like Wagner reported, he found evidence for parallel meridians but not for Mercator projection. Rather close to an equirectangular projection,[37] no evidence for conic or azimuthal projection.[38] The latitude lines, the parallels, were not curved but had sudden steps between basins.[39]
If the magnetic declination influenced the tilt of the portolans, like suggested by Breusing, one would find a change of this tilt, the magnetic variation, within the Mediterranean basin. The isogone charts of 1885 indicated a variation value of 14°.[40]
One of 1858 with 15° and that of Halley from 1700 only 8 - 9°. But he only found half a nautical point (5.6°) in the portolans on a basin to basin base. What he considered well too low. Further this value did not change much between the portolans even of different ages. He concluded that the declination could not have much influenced the portolans.[41]
He stated further that the declination could not be of influence because the change in tilt in the Mediterranean was by sudden steps. If the declination was a result of compass based dead reckoning navigation one would see smooth changes instead.[42]
Conclusion
He argued that in dead reckoning navigation one would rely on distances and much less on course directions. Because in these times according to the portolan books the directions were only down to the 64th part of a circle or 5.6°. It was not possible to draw the portolan coastlines by such coarse direction values.[43]
His final conclusion is an origin of source maps from older times. Compass and dead reckoning navigation was only used to compile these maps to whole charts of the Mediterranean.[44]
A lost publication?
In his 1918 reference to his portolan research Hermann Wagner spoke of "my and my pupils intense investigations from the years 1894-97"[45] The problem is that only from one "pupil", Steger, a publication on portolans is known. And neither from the year 1894 nor 1897 something is known.
Adolf Erik Nordenskioeld
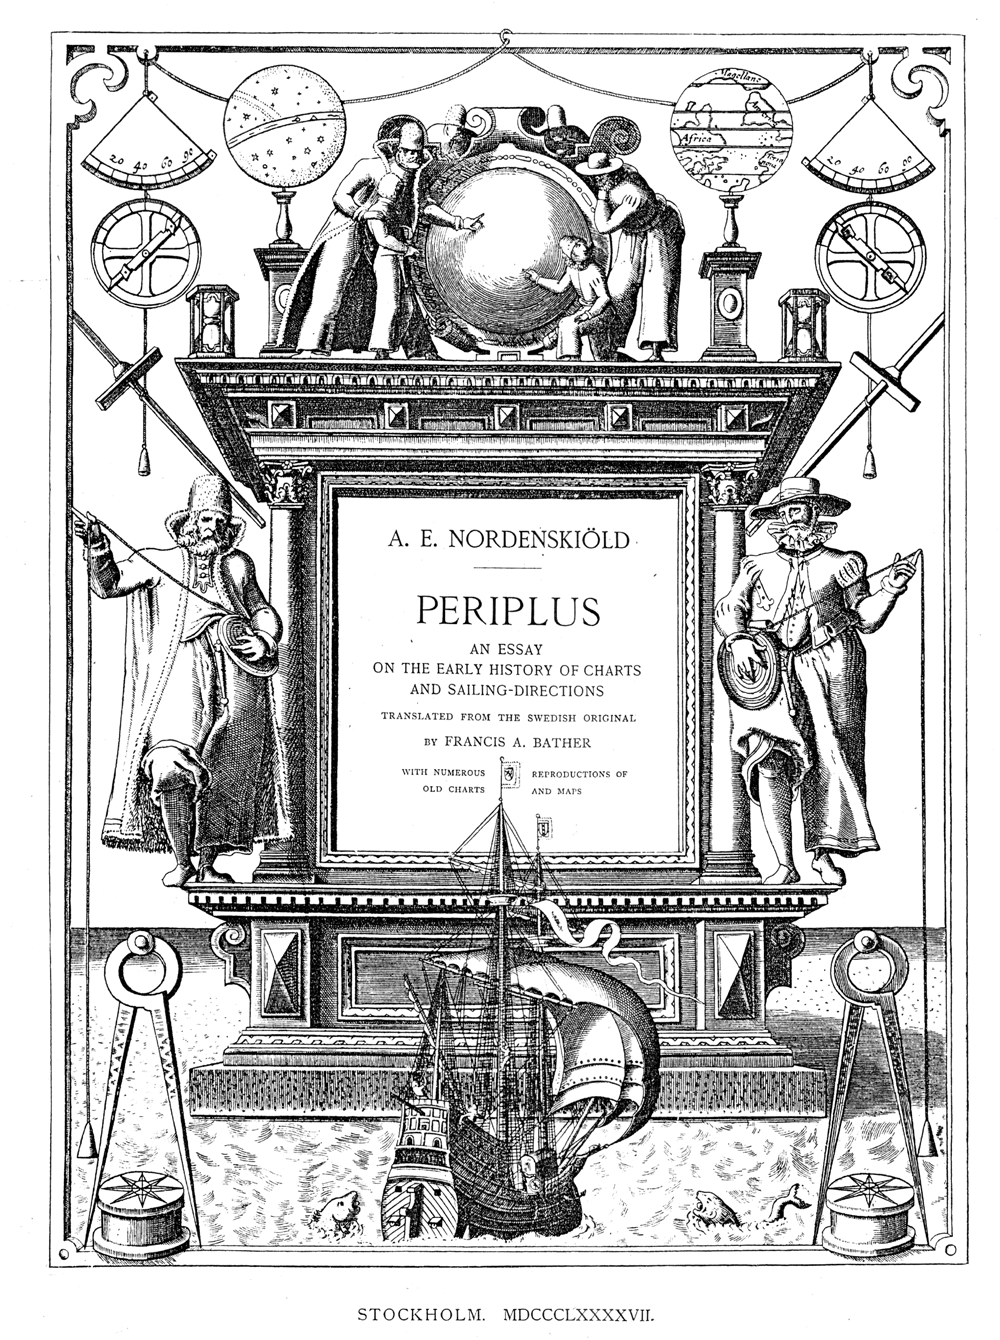
Nordenskioeld was a famous explorer of the 19th century and expert on the history of cartography. His central publications are "Facsimile-atlas to the early history of cartography", Stockholm 1889, and more on portolans: "Periplus: An Essay on the Early History of Charts and Sailing-Directions", Stockholm, 1897. Both contain a lot of high quality photographic reproductions. During his work on Periplus he gave a lecture in 1895 in London.[46]
He began the Periplus with a review to classical times. The transmitted literature we have from Greeks and Romans has only one single mention of sea charts. Nordenskioeld:
- "PTOLEMY, in the introduction to his "Geography", gives of a chart (from Tyre or drawn by the Tyrian Marinus), of which several revisions were published, and which, to judge from Ptolemy's description, must have been of essentially the same stamp as those mediaeval charts known under the name of portolanos."[47]
The Normal-Portolan
The portolan charts of the the 14th century are so very similar that he considers them all copies from one "Normal-Portolano".[48]
He presented extensive cartometric measurements of the length of the portolan mile. His conclusion was complex[49] and he concluded that the "length-measure for the normal-portolano" was "most probable that the Spanish, or rather the Catalan, legua."[50]
He devoted a whole chapter in "Periplus" to the study of classical portolan books. From that he saw evidence for the possibility that the portolan mile was based on a mile from Carthaginian or Greek / Roman times.[51]
Nordenskioeld saw the Normal Portolan compiled from older maps.[52] The compilation happened in the 13th century[53] and may be the work of an Catalan. [54] He further suggested that Raymund Lull (ca. 1235 - 1315) may be involved with the compilation.[55]
Compass
He doubted that the compass was of much relevance to the Normal Portolan.[56] The rhumb net on portolans was not a wind-rose of the later compass-rose style.[57]
MA portolan books
He sees striking similarities between two transmitted classical portolan books and some chapters in a book by Marino Sanudo (ca. 1320).[58]
Sanudo is considered the author of several early portolans, but they may have been drawn by Petrus Vesconte instead.[59]
A mystery is not only the sudden arrival of the portolans around 1300, but the lack of comments in literature until the 17th century.[60]
Waldo Tobler (1966)
In his 1966 paper [61] the famous cartographer and mathematician Waldo Tobler presented a somewhat radical approach. He suggested that any map has a projection. Even for a piece like the typical medieval Hereford map he presented one. His view is mathematically correct[62] but denies the projection question any value of it own.[63]
Tobler reopens the hypothesis of Breusing and Fiorini that the portolans had an unintended projection and that they were created from loxodromic magnetic directions. He was the only author to deal with the work of Steger. [64]
With reference to Clos-Arceduc, Tobler raised the question of an overall projection. Clos-Arceduc found a Mercator projection would fit better then an equirectangular one.[65] But the eastern portion of the charts are too far north in relation to Mercator’s projection, Tobler noted. Tobler now suggested an oblique Mercator projection [66] and further magnetic distortions in such a projection. [67]
He did not mention the necessary navigation accuracy but noted that several projections may give very similar results. Therefore he suggested to carefully use several portolan charts together to get an average shape and determine the error between the charts. That average inter chart error should be a benchmark for best fit projections.
Georges Grosjean
Grosjean was a leading geographer and cartography historian in Switzerland. He cartometrically analyzed and commented on the modern editions of two portolans.[68]
Not by Dead Reckoning
From this study he considers the portolans of classical Roman origin because of their accuracy. With ship and compass, with dead reckoning navigation, it was impossible to create accurate charts like the portolans.
This he considered to be obvious by comparing the results of leading navigators from the 16th and 17th century with the 14th century portolans. In a 1512 map of West Africa he found longitude errors of up to 100 %.[69] It is unthinkable that sailors of the 13th century, even in the more easy Mediterranean, could be so much better than the later ones.[70]
This is much like the opinion of Wagner who recommended to see the portolans in comparison with later charts. Grosjean got it on his own and hold this line of argument at least from the 1970s on. For such later map examples of the Mediterranean see: Abandoned for worse.
Grosjean considered it impossible to create portolan charts by ship with dead reckoning navigation. So he concluded the portolans were done by land based triangulation. There seems general agreement that by such geodetic surveys the accuracy of the portolans could be achieved.
Further, only in Roman times the area of the portolans was in unified political condition to allow such surveys. And only in Roman, pre-medieval times, the knowledge and resources for such a large operation was available.
We know of a successful Roman project to map the whole empire[71] and he mentioned evidence that the Romans already surveyed their empire in detail with the "centuriation".[72]
From that centuriation maps Grosjean suggested coastline maps were a spin off. On that point Campbell objected that not all of the empire was centuriated.[73] But it can be argued that a survey of the coast would be of even higher importance than of most inland area. The Roman Empire is known as a land power, but its maritime traffic exceeded anything before and was only topped in modern times.[74] For a ship it is a matter of survival to know dangerous coastal reefs or places to find shelter. For military operations knowledge of coastal topography would be essential too.[75]
Lines of Transmission
Grosjean saw the coastlines of the portolans in the direct tradition of the Roman imperial cartography. The so called "Geography" of Ptolemy he considers not a representation of Roman cartography but a medieval compilation from mainly medieval times and transmitted in monasteries. He suggests the portolan line of transmission was always with medieval sailors. Through continuous copying the port names were updated too. That way by the 13th century there was no longer a visible Roman link.
Another possible way he suggested was a medieval find of an old Roman map. It only had coastlines and someone put the names from a 13th century harbor list on it.[76] Either way there is no common link from the names to the geographical data.
Cuts from a Single Source Map
Grosjean never mentioned Wagner but got the very same results. Like Wagner he saw the Normal-Portolan compiled by smaller maps. The small differences between the Normal-Portolans were caused by slightly different assembly of this smaller maps.[77]
So far that's much like what Wagner found. But now the big news. The smaller maps the portolans were compiled with had to be cut sections of a former single source map (translated from German):
- "It was a matter of fact at all times that from adding together small maps one never gets a large map with correct general proportions, unless one has a network of independent control points[78] which allows the correct positioning of the small maps. Otherwise by simply adding together small maps one gets an accumulation of range- and direction errors so that after some distance nothing is correct.
- "But the general shape of the Mediterranean Sea in portolan charts is strikingly correct. Only in some parts there are discrepancies. But these don't accumulate, instead they offset each other."[79]
Therefore from the point of cartometry there was one single map in the beginning. At some point it was cut in sections, into smaller maps. In the 13th century only these sections, let us call it a source atlas, were available. From that atlas slightly different normal portolans were compiled.
Helmut Minow
Minow was surveyor engineer and chairman of the historical surveyor division of the German engineers society VDI. Like Grosjean he focused since the 1970s on distortion grids of portolan charts and their accuracy. He saw a Roman origin as most likely, kept a scientific bibliography and collected related historical information on it. A two part German summery article by him with cartometric images is on the internet.[80]
A. John Duken
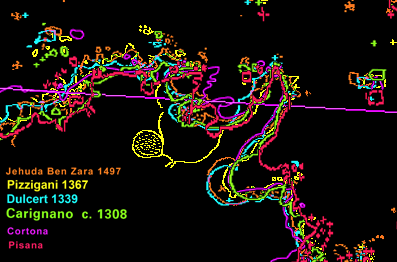
Duken, a former marine navigator, presented a projection that is probably still the best fit on a Normal Portolano.[81]
He used the Carignano chart (ca. 1310) and found that the main part of the Mediterranean and whole Black Sea could be covered by a single projection - an oblique stereographic one. The remaining two parts - west of Marseille and the Atlantic - could be covered by the same type but each with different scale and rotation. From that he found the accuracy of the Mediterranean basin to 25 km (0.68 %) and the mean error for the whole chart up to southern England seems to be in the same percentage range.[82]
His choice of projection was based on geometric issues and not related with previous cartometric publications but with publications on ancient mile measurements. He mentioned that the Carignano chart differs from other portolan charts he know in that the vertical and the horizontal axes related to the projection he found were also the basis of the rhumb net windroses.
He assumes this very complicated projection was used to provide compass courses. Because it "fit an idealized overlay of vertical and horizontal magnetic meridians and parallels." Post 2000 geomagnetic models would call it a very idealized overlay. Duken denies the possibility that the whole chart was created by dead reckoning navigation. Because of the accuracy he sees the chart as a projection based on true geographic coordinates. In a prior publication[83] he discussed options for land based longitude measurements in ancient times.
The oblique grid he considers the base of all portolan charts. But there are also some maps in which the west African coast north of the equator is plotted on this grid, for instance in a Venetian chart of 1484. He raised the question whether the magnetic meridians there in 1484 could really be similar with the Mediterranean ones around 1300. Nevertheless there seems to be evidence for some type of link to early portolans.
Scott A. Loomer
Loomer was an U.S. Army Captain and assistant professor at West Point. Subject for a proof of concept study[84] was an anonymous portolan from around 1400.[85]
He selected 201 control points, points that could be identified on the portolan charts and in the modern world, well distributed about the Mediterranean and Black Sea. The identification of such control points was a very difficult task. Loomer mainly relied on the port names, always under the assumption they were placed on the right geographic location.[86]
He tried the portolan points to 3 projections and got the following standard deviations (length in loxodrom degree):
- Lambert Conic = 1° (= 111.1 km)
- Square Grid = 0.75°
- Mercator = 0.468° (Rotation 9.5°)
He noted he got to the same Mercator projection like Waldo Tobler suggested in 1966.[87]
But the difference between square grid (actually he meant equirectangular) and Mercator projection is only 5 mm on a typical portolan chart. That is well within the distortions to expect by photographic reproductions.[88] Therefore Loomer suggested to use part of the rhumb net as reference grid to remove any distortions in further work.
Loomer heard[89] from earlier theories that portolans were compiled by basin maps. So he divided the Mediterranean into 7 parts and one for the Black Sea[90] The main result of the basin analysis is a tendency of increased rotation from west to east and the Black Sea was 10 % larger in scale than the mean.
His final thesis is not at hand for review and not on the Internet.[91]
Peter Mesenburg
Mesenburg, engineer and professor on surveying and cartography of University Duisburg-Essen focused on the accuracy of portolans. On the whole Mediterranean basin or whole charts, not subsections like Wagner. He investigated 15 portolans with about 350 reference points in each. The maximum error at a point was up to +-40 km.[92]
Compared to the wide of the Mediterranean basin that results in a mean error around 1 %. In one of his recent investigations he had similar results and concluded:
- "They substantiate the supposition that the portolan charts of Vesconte Maggiolo are remarkably accurate and that they were obviously constructed on the base of a terrestrial survey."[93]
His search for the projection in the portolans was still unsuccessful. Several projections were possible within the results, there was no clear statistical winner.
Waldo Tobler (2007)
In 2007 Tobler published a PDF [94] of a slide presentation with calculations he suggested in 1966 and some other results. First he presented data taken from the unpublished thesis of Loomer (1987) [95] and concluded: "Taken together these results tend to confirm Wagner’s conclusion that the charts were constructed by piecing together several older charts."
Then he presented the results of his 1966 suggested Tissot’s Indicatrix to measures the distortions. His final conclusion:
1. Tissot’s measures indicate that this portolan chart is neither conformal nor equal area.
2. Suggestions that it is based on a now-known map projection are erroneous.
3. It is more likely that it was based on empirical measurements (loxodromic distances and directions) in the Mediterranean, and was thus constructed to fit an unconscious hypothesis that the Earth is flat, resulting in an empirical map projection, and was put together from several separate sectional maps.
His Tissot images showed the then (2007) best distortion information but not more than the later Pizigani grid below. He considered the map "put together" but made no intention to identify the parts. [96] Probably he thought the resolution of the data points to be insufficient for such a task. But then point (2) is a conclusion on limited data. His final point (3) is a 19th century hypothesis [97] and never tested in reality or simulation. The idea that flat maps could be compiled to the accuracy of a portolan was straight out rejected by geodesy focused cartographers like Grosjean and Mesenburg.
Recent Research
Mesenburg confirmed the portolan accuracy found by Loomer. But Loomer was unable[98] to identify for sure the basin based subsections Wagner and Grosjean suggested.[99]
A new approach was launched with higher accuracy. From high quality reproductions of six early charts the coastline and rhumb net were digitized to ca. 0.2 mm. Then the rhumb net was vectorized and transformed to a geometrical perfect net. The resulted transformation data was applied on the coastline too. That way any distortion by photography or vellum shrink was removed. This corrected coastline was extracted and scaled to a common size for comparison of local areas. See example right.
The corrected coastline was then vectorized up to 10000 vectors for each chart, depending on the quality of the reproduction. This set of vectors was now the representation of the portolan chart.
In a first cartometric analysis the vectors were distorted to fit a modern geographical map in equirectangular projection based on 35° North. An example seehere.
So do not be confused that the "modern map" looks in detail like the portolan. It is one, but not by general shape. By this procedure the crucial problem to find identical points was much reduced. The vectors were first anchored at obvious geographical points like capes and bays. The vectors between such points were matched to the next probable feature or just slightly aligned with the coastline.
The equirectangular type of projection was used because it was the most simple one. The main objective was to identify the subsections of the charts, not the projection. The results were much like Wagner found before. The average error ("Mean Difference Vector", or RMS) of the whole Normal Portolan area was around 1.7 % of the Mediterranean wide, +- 60 km. The Atlantic part alone was ca. +- 30 km and smaller in size to around 85 %. The Mediterranean error alone was ca. +- 40 km what is 1.1 % its wide. The Black Sea alone ca. +-23 km by 106 to 110 % larger size compared to Mediterranean as 100 %.
Extensive calculations were done in search for the projection in the Atlantic part of the Pizigani chart. A square map could be ruled out, but anything else was inconclusive, too noisy. Like Mesenburg found before. The fit to the equirectangular projection within a mean error of 1 % is proof that there is a projection. But the difference between the common projections was too close to the mean error to decide on one.
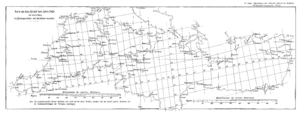
Distortion Grid
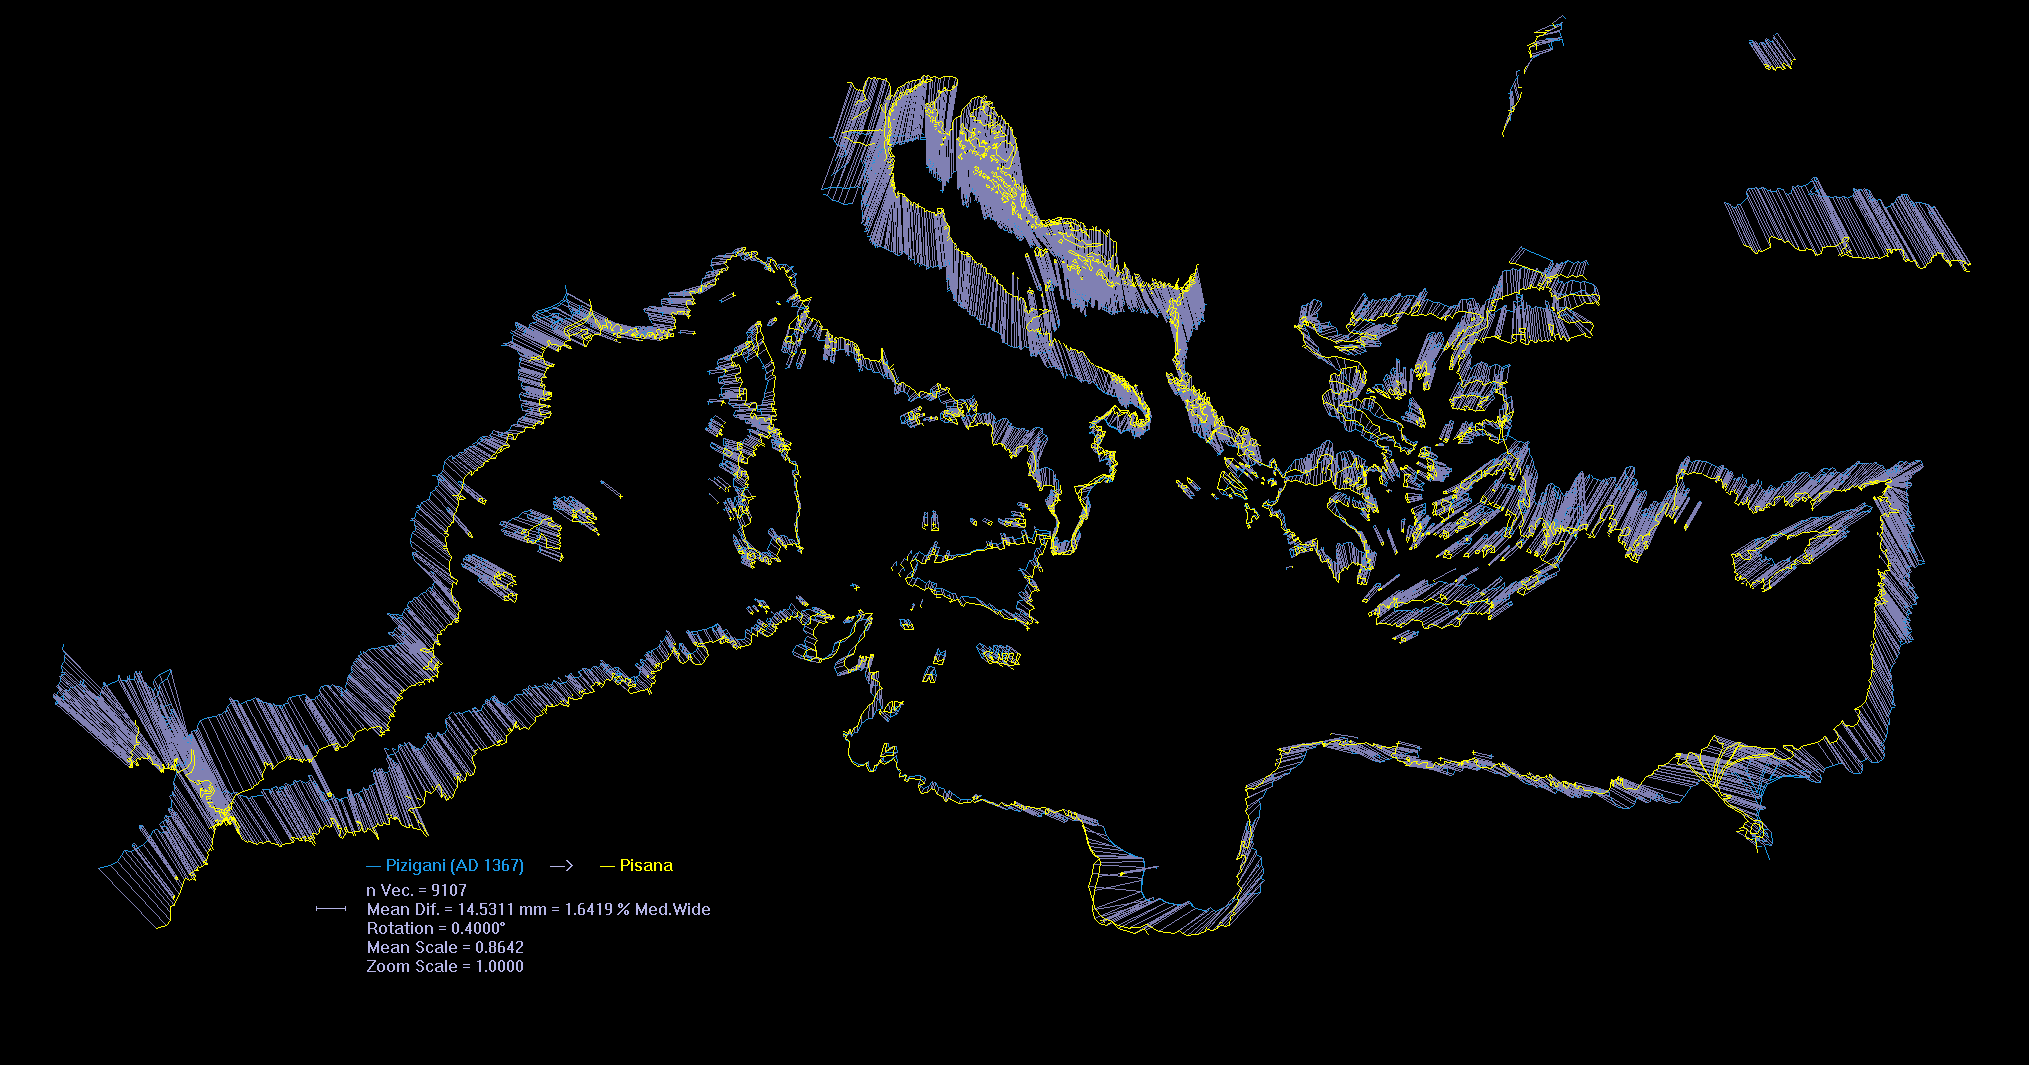
Grosjean was unable to identify the subsections by his distortion grids. With the transformation data to the equirectangular projection a distortion grid of the whole Pizigani chart was calculated. The task was not to smooth the grid lines but to reveal all distortions in the data. The result to the right is the most detailed distortion grid ever published for a portolan.
Again, do not be confused that the modern "True Geographical Map" looks in detail like the portolan. It is the portolan distorted to fit the modern map. The dots are the ends of the 10868 vectors. There is no obvious system in the distortion field. Steps between basins like the ones Steger found are very visible, like in the western Aegean Sea, which Wagner found in a Ptolemy too. But some are inside basins, too. Sardinia is a striking anomaly but not a basin. This grid looked more like a puzzle from small maps than from basin based ones.
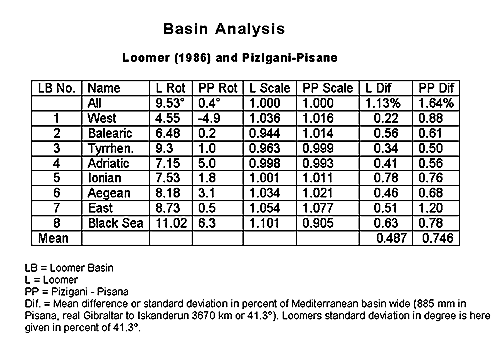
Pizigani-Pisane Comparison
The next step was an comparison analysis of the Pizigani on the Pisane chart. The vector net of the Pizigani was distorted to the Pisane instead to a modern map. That way the Pizigani was used as benchmark or base for the Pisane. There are two points to gain this way. First, by its coastline features a portolan could be fit to another portolan with higher accuracy than to a modern map. Second, an error in the suspected common source map would no longer be present to distract from the different medieval compilation errors. The Pisane was chosen because of its most serve compilation errors. The Pizigani because of its relation to an early 13th century chart which suggests it to be a most careful drafted compilation by someone with good knowledge on portolans.
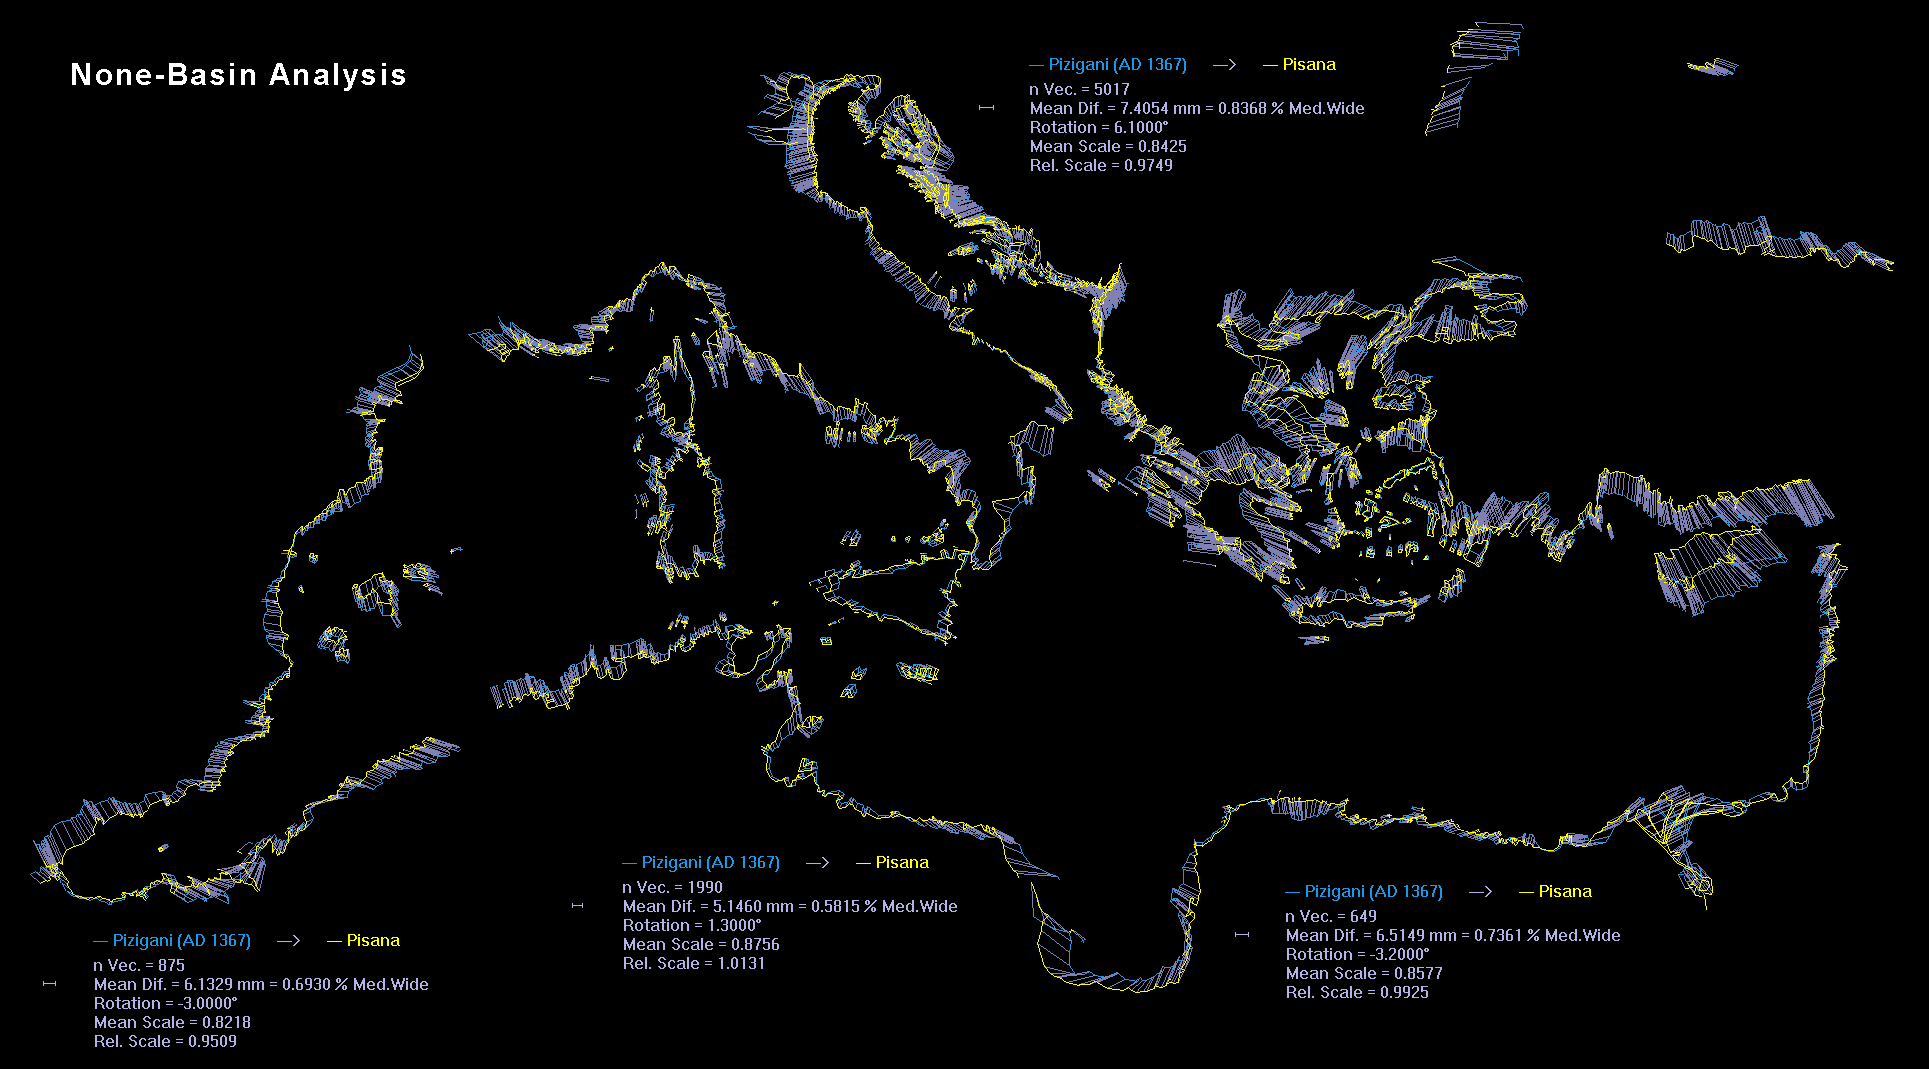
Besides an overall run the analysis was done on 8 basins like described and done by Loomer. Regarding the average error it is remarkable that the portolan of Loomer, overall and basin based, fit better to a Mercator map (0.487 %) than the Pizigani to the Pisane (0.746 %).
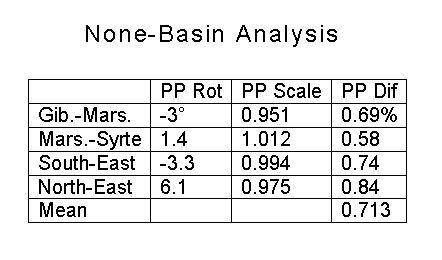
The crucial point was the next step. Instead of basin based sections a more grid related one was used. Like first noted by Duken (1984), portolans show an anomaly tilt somewhere near the meridian of Marseille. That was tried as cut line. A look on the overall fit showed a strong anomaly at the Gulf of Iskanderun (NE edge of Med). That and the poorly depicted Syrte were chosen as further cut lines. These are the results for such a none geographic sectionized approach:
So with only 4 sections instead of 8 a lower average error (0.713 %) was achieved. That is a surprisingly strong indication that the cut system was not basin based and supports the same find by the distortion grid.
At about that time the recent request by Tony Campbell for a cartometric analysis of the Pisane was noted. During that task a sectionized fit of the Pisane to an equirectangular modern map was done. Here it was noted that the southern coast of Spain had by 104.1 % a considerable other scale than the north African coast opposite with 96.3 %. After the comparison analysis from before the reason was obvious: Between this parts was the 36th parallel that also was at the northern Levante anomaly. Next step was a systematic trial of several types of grids what suddenly got a striking fit to known portolan anomalies. The atlas was probably a set of 5 x 5 gon grid sections. For the details see Traces of the Source Atlas.
References
- Jump up ↑ Campbell, Tony: "Portolan Charts from the Late Thirteenth Century to 1500," in: The History of Cartography, volume one, Cartography in Prehistoric, Ancient, and Medieval Europe and the Mediterranean, edited by J.B. Harley and David Woodward. Chicago: University of Chicago Press, 1987, pp. 371-463. - He mentioned Wagner and Grosjean but not their main points of argument. Maybe he was misled by the paper of Winter (1948) he mentioned.
- Jump up ↑ Lelewel, Joachim: Geographie du moyen-age. (I. and II. in one book) Bruxelles 1850. (The "1850" is on the book front page but in some catalogs one finds "1852-57".
- Jump up ↑ *Peschel, O.: Geschichte der Erdkunde I. Auflage. 1865. S. 196.
- Peschel, O.: Geschichte der Erdkunde II. Aufl. 1877 S. 216.
- D'Avezac: Bulletin de la societe' de Geographie. Paris 1863 Ser. V Tom. V S. 298.
- Jump up ↑ Zeitschrift der Gesellschaft für Erdkunde 1869 S. 48.
- Jump up ↑ Fiorini, M.: Le Projezioni delle carte geografiche. Bologna 1881
- Jump up ↑ Wagner, Hermann: Die Entwicklung der wissenschaftlichen Nautik, Annalen der Hydrographie, Jg. 46 (1918) pp. 105-118, 153-173, 215-233, 276-283. Here page 110.
- Jump up ↑ Winter, Heinrich: The True Position of Hermann Wagner in the Controversy of the Compass Chart, in: Imago Mundi 5 (1948) pp. 21-26
- Jump up ↑ Winter cited from the paper of the lecture of Wagner in 1895 and declared: "the exposition of 1895 may be open to doubt." Therefore he continued:
- "Wagner's text book, published in 1879, must serve to establish his real meaning. In it he states 'that the Italians succeeded with the aid of the compass in establishing those surprisingly accurate calculations which are preserved in the so-called Portulan charts since 1300'. This is not a denial but on the contrary and without any reservation, a recognition of the influence of the compass on the development of the Portulan chart." Winter (1948), pp. 21f
- But Wagner opened the 1895 lecture with the remark that he will now demolish Breusing's "building of speculations" on the compass link:
- "...wenn ich es nunmehr wage, das ganze Gebäude von Spekulationen umzustürzen, die Breusing dereinst über eine wichtige Spezialfrage, die Entstehung der sogenannten Kompassskarten, in scheinbar unwiderlegbarer Klarheit entwickelt hatte." Wagner (1895), p. 66
- And there Wagner said he himself in the past supported the view of Breusing on the the compass link:
- "Diese an sich geistreiche Auffassung, gestützt durch eine bestechende schematische Figur 1), hat nun in Deutschland rückhaltlosen Beifall gefunden, und ich selbst war, ehe ich mich mit der Sache näher befafste, von ihrer Richtigkeit überzeugt." Wagner (1895), p. 69
- Instead of mentioning that Wagner changed his opinion from 1879 to 1895, Winter even claimed the opposite: "In the lecture already noted ("Ratsel der Kompasskarten"), too, he says nothing which could be interpreted as an abandonment of his principal meaning." Winter (1948), pp. 22
- Winter had references to Wagner and Steger but he concludes:
- "Thus we arrive at the general conclusion that the Portulan chart is based on the compass - no counter argument, at any rate, has been found - that it is intended that the network of lines shall be used in conjunction with a compass and hence the expression 'compass chart' is fully substantiated." Winter (1948), pp. 24.
- In the following the suppressed arguments of Wagner and Steger are presented in an effort to correct the damage Winter did with his paper.
- Jump up ↑ Wagner (1895), Verhandlungen des deutschen Geographentages, XI 1895, S. 65 - 87: "Das Rätsel der Kompasskarten im Lichte der Gesamtentwickelung der Seekarten." [The Mystery of the Compass Charts in Light of the General Development of Nautical Charts.] Von Geh. Reg.-Rat Prof. Dr. Hermann Wagner in Göttingen. The article is a transcript with further notes by Wagner. In one of the notes he mentioned the London Congress of August 1995 as past but he had not read the transcripts yet.
- Jump up ↑ Wagner (1896): Wagner, Hermann: The Origin of the Mediaeval Italian Nautical Charts, in: Report of the Sixth International Geographical Congress, London: Royal Geographical Society, 1896, pp. 695-705
- Jump up ↑ Wagner gives this reference: "Zeitschr. f. wiss. Geogr. II. 1881, S. 187."
- Jump up ↑ "Speculations" because Breusing never presented cartometric results of his theory. Wagner (1895), page 70: "Er bleibt bei der nackten Behauptung stehen, ohne irgend einen sinnfälligen Beweis, sei es durch über einander gezeichnete Karten, durch Einzeichnung einer Kegelprojektion in eine Kompass-Karte, sei es durch Auswahl charakteristischer Beispiele über den Verlauf einer gebogenen Breitenparallele und dergl."
- Jump up ↑ "I would point out that this theory attributes a much more extensive nautical knowledge to the Italians of the fourteenth and fifteenth centuries than to the navigators of the age of discoveries. I would further draw your attention to the fact that the transition from the loxodromic map of the middle ages to the plane charts of the sixteenth and seventeenth centuries involves a real retrogression in the development of the sea-charts. Such a retrogression is, in my opinion, by no means probable." Wagner (1896) p. 697
- Jump up ↑ "A priori ist also der Gedanke, die Mittelmeer-Karten seien ein plötzlich um 1300 auftretendes Erzeugnis italienischen Scharfsinns, entschieden zurückzuweisen." Wagner (1895), p. 73f
- Jump up ↑ "Das heisst nichts anderes, als dass Karten verschiedenen Massstabes zu einem einzigen Bild vereinigt sind." Wagner (1895), p. 76f
- Jump up ↑ "One sees a distinct parallelism of rectilineal meridians and rectilineal parallels. Nothing is to be discovered of a conic network with curved parallels. Nor do curved meridians appear, such as are required by Fiorini's hypothesis." Wagner (1896), p. 699
- Jump up ↑ "Yet also these measurements should show that the southern degrees of latitude are on an average smaller than the northern ones. This is, however, in a general manner, certainly not the the case. In short, the hypothesis of loxodromic charts of the Middle Ages cannot be maintained." Wagner (1896), p. 700
- Jump up ↑ Wagner (1895), p. 80f
- Jump up ↑ Wagner (1895), p. 84f
- Jump up ↑ Wagner (1895), p. 83ff
- Jump up ↑ Wagner (1895), p. 82
- Jump up ↑ Wagner (1895), p. 87
- Jump up ↑ Wagner (1896), p. 702:
*"None of them appears to me more typical than the fact that the east coast of Greece has been drawn much too long in comparison with the western coast. It is a fundamental error of these maps, which has been transmitted into the seventeenth century, that Cape Linguetta lies parallel with the Gulf of Volo, instead of with the Gulf of Saloniki. Here, also, a simple turn of the map is of no use to remove the error, or to rectify the strange discontinuity of the fortieth parallel. This is totally independent of the declination of the compass-needle.
*"And observe exactly the same error with all its consequences appears on the maps of Ptolemy. It is one of the most striking errors of orientation on the map of Ptolemy, that Rhodos and Argos have been placed in the same latitude, instead of Rhodos and Cythera. The southern half of the archipelago has been oriented just as wrongly by Ptolemy as by Vesconte (1318), and in all the later maps of the Italians. It will be impossible to look upon this coincidence as a mere accident. We must rather recognize a proof in this fact that the Italians were in possession of very ancient traditions, not only with respect to sailing directions, but also to maps."
- Jump up ↑ "Darf dies Beispiel nicht als ein vollgültiger Beweis angesehen werden, dass es zum Teil uralte Überlieferungen und zwar in Kartenbildern sind, welche die italienischen Kartographen zur Grundlage der ihrigen nahmen und zu nehmen gezwungen waren?" Wagner (1895), p. 86
- Jump up ↑ Wagner concludes:
- "The Italians have combined into one picture maps of various scales, according to the principle of the plane-charts, but without reference to the network of degrees at all. In doing so they have generally not been conscious of any difference in the length of the mile on either side of the Strait of Gibraltar.
- "Yet there is no lack of attempts to remove this discrepancy on maps. The atlases of Giacomo Giraldi of 1426, for instance, the map of Beccario of 1436, the Lucerne map, etc., have the Atlantic coasts drawn considerably larger as compared with the coasts of the Mediterranean, or, in other words, have assigned the same absolute value of about 4100 feet to the mile on either side of the Pillars of Hercules. But this school of cartography seems not to have prevailed.
- "Only in the seventeenth century were the fundamental errors of the map of the Mediterranean definitely removed - namely, by reducing all the dimensions. The fact that this was accomplished so late manifestly shows how easily satisfied the mariners of former centuries were with reference to exactitude in the indication of direction and distance. It is a great mistake of most historians of mathematical geography to attribute far too exact a knowledge to the various ages of the past. A more profound study convinces us of the contrary in each case." Wagner (1896), p. 702
- Jump up ↑ Wagner (1896), p. 698
- Jump up ↑ Wagner, Hermann: Lehrbuch der Geographie, 10. Ed., Hannover (1920), p. 204f
- Jump up ↑ Steger, Ernst: Untersuchungen über italienische Seekarten des Mittelalters auf Grund der kartometrischen Methode, Goettingen 1896. Reprint without main map: Acta Cartographica, XII, 1971, pp. 395-448.
- Jump up ↑ One by written by Antonio da Uzzano in 1440. Another from 1480 perhaps by Alvise Cadamosto. See Steger (1896), p. 17 for more details.
- Jump up ↑ Steger suggested the existence of medium range coastline maps. Only such maps could have the local information that were on portolan charts but not in the portolan books. But from such presumed available coastline maps it was not possible to derive the data in the portolan books. That seems the essence of what Steger (1896) wrote at page 18. The words "den bereits vorliegenden Karten" refer to maps available before the first medieval portolan charts were drawn.
- Jump up ↑ Steger (1896), p. 26
- Jump up ↑ Steger (1896), p. 25
- Jump up ↑ Steger (1896), p. 23f
- Jump up ↑ "Wir haben es hier offenbar mit typischen Kartenfehlern zu thun, wie sie uns entgegentreten in der westöstlichen Auseinanderzerrung des Iberischen Meeres, in der beträchtlichen Heranrückung der Südküste Sardiniens an die Küste Afrikas, in der westöstlichen Zusammendrückung der grossen Syrte u. a. m.; sie kehren fast auf allen Karten wieder und können als Beweis angesehen werden dafür, dass diese grösseren Uebersichtskarten des Mittelmeers sich, zum Teil wenigstens, auf schon vorhandene, speziellere Küstenkarten und Karten einzelner Meeresteile gestützt haben." Steger (1896), p. 25f
- Jump up ↑ "Hätten die Kartenzeichner ihre Karten nur auf Grund der mit Hilfe des Kompass genauer festgestellten Kurse und Distanzen entworfen, wären so regelmässig wiederkehrende Verzerrungen ganzer Küstenstrecken und Meeresbecken nicht erklärlich." Steger (1896), p. 26
- Jump up ↑ Steger (1896), p. 27f
- Jump up ↑ Steger (1896), p. 30
- Jump up ↑ Steger (1896), p. 33f
- Jump up ↑ Steger (1896), p. 31
- Jump up ↑ That meant that an expected difference in tilt would be 14° than. So a portolan chart with an average tilt of 7° would 1885 in the East be tilted 14° and in the West 0°, nothing at all.
- Jump up ↑ Steger (1896), p. 35f
- Jump up ↑ Steger (1896), p. 36
- Jump up ↑ Steger (1896), p. 42
- Jump up ↑ Steger (1896), p. 43
- Jump up ↑ "Ich glaube, daß inzwischen meine und meiner Schüler eingehende Untersuchungen (10) aus den Jahren 1894-97, die zu wesentlich anderen Ergebnissen führten, so mannigfache Zustimmung - jedenfalls noch keine Widerlegung - gefunden haben, daß ich mich kurz fassen kann." Wagner (1918), p. 110. The reference (10) is only his paper of 1895.
- Jump up ↑ "Resume of an essay on the early history of charts and sailing directions." in: Report of the Sixth International Geographical Congress, London: Royal Geographical Society, 1896, pp. 685-695
- Jump up ↑ "Charts, i. e. maps specially intended for sea-farers, are not even alluded to by the older Greek and Roman authors. But that such charts really existed during the period here in question, is shown by the account which PTOLEMY, in the introduction to his "Geography", gives of a chart (from Tyre or drawn by the Tyrian Marinus), of which several revisions were published, and which, to judge from Ptolemy's description, must have been of essentially the same stamp as those mediaeval charts known under the name of portolanos. The charts of Marinus are not spoken of by other Greek or Roman authors, any more than are the portolanos, with some few exceptions, ever mentioned in the writtings of the schoolmen, although they were the most complete cartographical works of the Middle Ages."
Nordenskioeld (1897), p. 3
- Jump up ↑ "...the original normal-portolano, the primaeval type, which was copied by Vesconte, Dulcert, Benincasa, Bianco, Voltius, and other drawers of portolanos from 1300 to 1600." Nordenskioeld (1897), p. 17
- Jump up ↑ Nordenskioeld in Periplus:
- "1) that the original normal-portolano used a length-measure of 3'.15 or 5830 metres; it is this length-measure that I have named portolan-mile;
- 2) that the scale of distance depending on this measure of length was kept unaltered in all portolanos up to the 17th century;
- 3) that the Italian portolan-manufacturers and portolan-draughtsmen did not know this length-unit, but that they sometimes tried to fit the Italian mile-measure with the portolan-scale, by assuming that the distance between two points of the scale corresponded to 10 miglia; whence one miglio got the utterly erroneous value of 0.2 p.m. or 1166 metres;
- 4) that at times also when the portolan-scale was adapted to the Italian mile-measurement, the nearly correct proportion of 1 miglio = 0.25 p.m. or 1457 metres was assumed;
- 5) that when, in the 16th century, the portolanos were ruled in degrees, the portolan-scale was kept unaltered; but the degree of latitude had assigned to it a completely erroneous value in portolan-miles, depending on an incorrect estimate of the size of the globe. As a rule the earth has been considered smaller than it really is, and this is also shown by the much discussed correspondence between Columbus and Toscanelli, and has not been without influence upon the history of discovery of the New World." Nordenskioeld (1897), p. 23
- Jump up ↑ "I therefore consider it most probable that the Spanish, or rather the Catalan, legua was the length-measure for the normal-portolano, and subsequently copied, down to the 17th century, in Italy and other countries round the Mediterranean, evidently without knowledge of the meaning of
the scale. The old portolan-scale still occurs on a portolano signed Iouan Battista Cauallini in Liuorno anno 1642." Nordenskioeld (1897), p. 24
- Jump up ↑ Nordenskioeld: "It should be noticed that if 10 "marine" stadia be considered as equal to 1' [arc minute], a relation which seems to follow from the statements of distance in Scylax and in the Stadiasmus [two ancient portolan books], and further if it be supposed with HERODOTUS (II: 6) that 60 stadia go to the Egyptian (Phoenician?) length-measure schoinos (OXOIPOS), then one schoinos becomes, as near as may be, the same as the distance between two points of the portolan-scale, i. e. 2 p.m. [portolan mile] It is therefore possible that the measure used in the portolanos had its ultimate origin in the time when the Phoenicians or Carthaginians ruled over the navigation of the western Mediterranean, or at least from the time of Marinus of Tyre." Nordenskioeld (1897), p. 24. Note that Marinus of Tyre is usually considered temporary or only few generations older than Ptolemy (ca. AD 150).
- Jump up ↑ "But before doing so I shall try to determine when and where the normal-portolano was composed, or rather when a number of sketch-maps and reports by skippers, founded on a long experience, were collected and united to form the most perfect map of the Middle Ages, the Iliad of Cartography which we still so highly and so justly admire." Nordenskioeld (1897), p. 45
- Jump up ↑ "From all this it seems exceedingly probable, that the normal-portolano was produced with the aid of older special charts during the 13th century, probably after 1266, when Caffa was founded." Nordenskioeld (1897), p. 46
- Jump up ↑ "I no longer hesitate to declare that the normal-portolano is a Catalan work." Nordenskioeld (1897), p. 47
- Jump up ↑ Nordenskioeld (1897), p. 54
- Jump up ↑ "There is no proof that the compass was commonly used by the coasting mariners of the Mediterranean at the beginning of the 13th century; and at first, when the compass consisted of a magnetic needle enclosed in a tube so as to float on water, accurate determination of the cardinal points by means of this was hardly possible on a tossing sea. In the clear atmosphere of the Mediterranean the sun and stars were far safer guides for the navigator: they showed the true quarters without misdirection." Nordenskioeld (1897), p. 47
- Jump up ↑ "Many investigators, even D'Avezac generally so reliable, have considered the compass-rose to be a characteristic of all portolan-maps. This however is quite incorrect.
- "There are no wind-roses at all on the oldest portolanos; later on a solitary wind-rose occurs on each map-sheet in order to indicate the position of the map with regard to the cardinal points, and not until the 16th century are a number of wind-roses drawn on the same map-sheet," Nordenskioeld (1897), p. 47
- Jump up ↑ "On comparing, for instance, the periplus of Scylax or the Stadiasmos with some chapters of Marino Sanudo's 'Secreta fidelium crucis' (circ. 1320), one would almost think that Sanudo was giving a translation of one or the other." Nordenskioeld (1896), p. 686
- Jump up ↑ Nordenskioeld 1897 p. 14, note 1: "KONRAD KRETSCHMER (Marino Sanudo der Altere und die Karten des Petrus Vesconte. Zeitschr. d. Gesellsch. f. Erdk. zu Berlin, XXVI, 1891) maintains that the maps occurring in the work of Sanudo, some of which have been printed in BONGARS' Gesta Dei per Francos, Hanoviae 1611, are drawn by Vesconte..."
- Jump up ↑ "But, this admitted, it remains to decide where and when the original of the normal portolano was composed. There are no passages in mediaeval literature.html which give any help in deciding these questions; even the existence of portolani was ignored by learned men of the fourteenth to the seventeenth centuries. No portolani are spoken of in the many cosmographies of the sixteenth century,..." Nordenskioeld (1896), p. 686
- Jump up ↑ W. Tobler, 1966, "Medieval Distortions: The Projections of Ancient Maps", Annals, Association of American Geographers, 56(2):351-360.
- Jump up ↑ From a mathematical point of view a projection is not just a simple equation like used for an equirectangular or Mercator. Instead it is any algorithm or procedure that transforms one image to another. But any type of geometrical shape could that way be changed to an accurate map outline, which makes the whole projection issue rather senseless. Because of that all other cartographers focused on a rather small set of possible projections.
- Jump up ↑ Once you restrict to a common set of projections known today a whole new game opens. First it raises the question which one is the best fit. If several fit similarly well the next question is what is the most likely projection. Here one has to take into account the mathematical skills of the suspected time of creation. The author of the Hereford map may be on the level of a second grade elementary school student today. Ptolemy instead showed mathematical skills of a university graduate today.
- In the end a Mercator projection points to an origin as a nautical map created for ship use. But a stereographic projection points to a geographical scientist as originator. An equirectangular projection points to a simple and easy to understand universal tool - like mentioned in classical times for Marinus of Tyre.
- Jump up ↑ He criticized him for not extending the investigation to the Black Sea, and that "his meridians and parallels are virtually all determined by only two points." A look at Steger's map shows that most net lines had several points. But more importantly, each point gave from its coastline context a local rotation vector information too. Steger's main find was the sudden change in scale and grid direction between and inside basins of the Mediterranean.
- Jump up ↑ Tobler calls this a "square projection".
- Jump up ↑ It should be directed somewhat along the central south to north portolan rhumb line. This is different to any Mercator in discussion before or after him. All others rotated the chart and then fit a Mercator projection. Instead an oblique Mercator projection transformed the whole geographic grid net from the north pole to another virtual pole. In his example the pole was at 55.55° N, 14.58° E (Baltic, south of Sweden). That is a place the magnetic pole in historical times never came even close to. But it creates for the whole chart from the Atlantic to the Black Sea a distortion somewhat like the portolans. Of course the fit is much poorer than other Mercators who focus only on the Mediteranean.
- Jump up ↑ He could not compare the expected distortions with historic geomagnetic models. Those models of the 1960s were not sufficient to get the 13th century field. His idea is, much like Breusing, that this projection was unintentionally created by dead reckoning compass navigation.
- Jump up ↑ *Grosjean, Georges: The Catalan Atlas of the Year 1375, Dietikon-Zuerich, 1978
- Grosjean, Georges: Der Seeatlas des Vesconte Maggiolo vom Jahre 1512
Dietikon-Zuerich, 1979
- Jump up ↑ It was in the "Seeatlas des Vesconte Maggiolo" Grosjean (1979), p. 30. The large errors were only at west east distances (Cabo Palmas to Kamerun). There they had only dead reckoning navigation. But elsewhere in north south distances they could use latitude measurements that gave better results.
- Jump up ↑ "Einfache Überlegungen zeigen aber, dass Karten dieser Genauigkeit niemals vom Schiff aus mit Kompass vermessen worden sein können. Die Konstruktion von Verzerrungsgittern zeigt, dass die Portolane im Mittelmeer und Schwarzmeer viel geringere Verzerrungen aufzeigen als z. B., die entsprechenden Karten in den niederländischen Atlanten des 17. Jahrhunderts... Es ist schlechthin undenkbar, dass die Seefahrer von Mallorca, Genua, Pisa, Ancona und Venedig, die vor allem Portolane erstellten, schon im 12. und 13. Jahrhundert viel genauer gearbeitet hätten als die grossen Seefahrer des 16. und 17. Jahrhunderts, auch wenn das mittelländische Meer viel ruhiger ist. Mit Kompass vom Schiff aus kann man schlechthin nicht solche Karten aufnehmen." Georges Grosjean: Geschichte der Kartographie, Bern 1996 (3rd Ed.), p. 19
- Jump up ↑ According several classical sources it was ordered under Caesar and completed under Augustus in AD 14. The so called world map of Agrippa was one result. See: Dilke, O. A. W.: "Maps in the Service of the State: Roman Cartography to the End of the Augustan Era", in: The History of Cartography, volume one, edited by J.B. Harley and David Woodward. Chicago: University of Chicago Press, 1987, pp. 205ff
- Jump up ↑ He used the German word Limitation (from Latin limitatio) in Grosjean (1979), p. 36f. The English term is centuriation. For an example see here
- Jump up ↑ Campbell commented to Grosjean (1978), pp. 17-18. Campbell`source is O. A. W. Dilke: "The Roman Land Surveyors: An Introduction to the Agrimensores" Newton Abbot, 1971, pp 134-58. He further noted: "A similar thesis had been proposed earlier in a work not mentioned in Grosjean's bibliography: Attilio Mori, "Osservazioni sulla cartografia romana in relazione colla cartografia tolemaica e colle carte nautiche medioevali," in Atti del III Congresso Nazionale di Studi Romani, 5 vols. (Bologna: Cappelli, 1934), 1:565-75. This was discussed in the Monthly Record section of the Geographical Journal 87 (1936): 90-91." Campbell (1987) p. 381
- Jump up ↑ That is mainly the result of archaeological work. For an example of size, there is a whole mountain of shipped amphorae remains near Rome. For range, fish sauce amphorae from southern Spain were found in a fort at the Hadrian's Wall.
- Jump up ↑ In case of an uprising troops could land in the rear of the enemy or outside ports. Such operations are only feasible with detailed coastal maps.
- Jump up ↑ Grosjean (1979), p. 37
- Jump up ↑ "Die Gesamtanlage der Konturen des Mittelmeeres, des Schwarzen Meeres und der europäischen Westküste bleibt durch fast zweieinhalb Jahrhunderte stabil. Gewisse Veränderungen kommen dadurch zustande, daß die in einzelne Teile zerlegte Karte von verschiedenen Kartographen etwas anders zusammengesetzt werden." Grosjean (1979), p. 37
- Jump up ↑ Usually these are points in the landscape, often at mountains, where the position in geographical coordinates was determined by astronomical ways. The Romans had the knowledge to do this by land based observations of solar and lunar eclipses.
- Jump up ↑ "Es war zu allen Zeiten so, daß man aus dem Zusammensetzen kleiner Detailaufnahmen nie Karten bekommt, die in ihren Gesamtproportionen richtig sind, wenn man nicht über ein Netz von übergeordneten Fixpunkten verfügt, welche erst das richtige Zusammenfügen der Detailaufnahmen erlauben. Denn beim bloßen Aneinanderreihen von Detailaufnahmen kumulieren sich Distanz- und Richtungsfehler, so daß über eine gewisse Strecke nichts mehr stimmt. In den Mittelmeerabbildungen der Portolankarten stimmt aber die Gesamtanlage auffällig, während in einzelnen Partien durchaus Unstimmigkeiten sind, die sich aber nicht kumulieren, sondern wieder ausgleichen." (1979), p. 27
- Jump up ↑ Minow, H.: Portolankarten (I) & (II), Geomatik Schweiz 6 & 7/2004
- Jump up ↑ Duken, A. J.: Reconstruction of the portolan chart of G. Carignano (c. 1310), in: Imago Mundi, Vol 40 (1988), pp. 86-96
- Jump up ↑ By copyright of "Imago Mundi" it could be a problem to present his final fit of 1988. But it is on the internet in the 2004 publication by Minow
here.
It is "Abb. 4"
- Jump up ↑ Duken, A. J.: Die mathematische Rekonstruktion der Portolankarte des Giovanni Carignano (ca. 1310). Bückeburg 1984
- Jump up ↑ Loomer, Scott A.: Mathematical Analysis of Medieval Sea Charts, in: Annual Convention of Carthography and Education, Vol. 1, 1986, ACSM - AVPRS.
- Jump up ↑ Portolan IV, 1912, from Biblioteca Nazionale Marciana, Venice, Italy.
- Jump up ↑ There is no study yet that investigated the accuracy of the location of port names on portolans. Often they are so dense and close to each other that probably the available writing space was a main positional factor.
- Jump up ↑ Tobler, Waldo R.: "Medieval Distortions: The Projections of Ancient Maps" Annals of the Association of American Geographers, 56, No. 2 (1966), pp. 322, 351-360
- Jump up ↑ If the focal center of the camera is on the northern Mediterranean, most optical systems will distort an equirectangular projection towards a Mercator.
- Jump up ↑ He mentioned three not then published papers by Tony Campbell and David Woodward.
- Jump up ↑ His chart lacked most of the Atlantic coast.
- Jump up ↑ Loomer, Scott A.: A cartometric analysis of portolan charts: a search for methodology. Ph.D. Thesis, University of Wisconsis, Madison (1987)
- Jump up ↑ Mesenburg, Peter: Portolankarten - Die vermessene Welt des Mittelalters, in: Gutenberg und die Neue Welt, Kap. 3, Muenchen, 1994, S. 59-76.
- Jump up ↑ Mesenburg, Peter: Zur Genauigkeit der Portolane im Seeatlas des Vesconte Maggiolo (1512). In: Karten - Wissenschaft, Festschrift zum 65. Geburtstag zu Ehren von Prof. Istvan Klinghammer - Studia Cartologica 13, Zentai, L., Györffy, J., Török, Z. (Hrsg.), S. 283-292, ELTE Budapest, 2006.
Here.
- Jump up ↑ "Properties of Portolan Charts" at: http://www.geog.ucsb.edu/~tobler/presentations/Portolani.pdf
- Jump up ↑ S. Loomer, 1987, "A Cartometric Analysis of Portolan Charts", Ph.D. Dissertation, University of Wisconsin, 235 pp.
- Jump up ↑ For example that the Atlantic was a distinct part with its own scale (in classical Roman Miles) was already found by Wagner and never disputed.
- Jump up ↑ It is notable that Tobler wrote "loxodromic distances and directions" but neither mentioned a compass nor a ship like in 1966. He could have had in mind terrestrial triangulation like Loomer (1986) suggested and the Romans did for a (small?) part of the portolan coast.
- Jump up ↑ That is an assumption because he was in contact with Tony Campbell and David Woodward and they did not report on such a discovery.
- Jump up ↑ To be more precise only Wagner suggested them basin based. Grosjean did not speculate on the cut lines location.